29
/
en
AIzaSyAYiBZKx7MnpbEhh9jyipgxe19OcubqV5w
April 1, 2024
26676
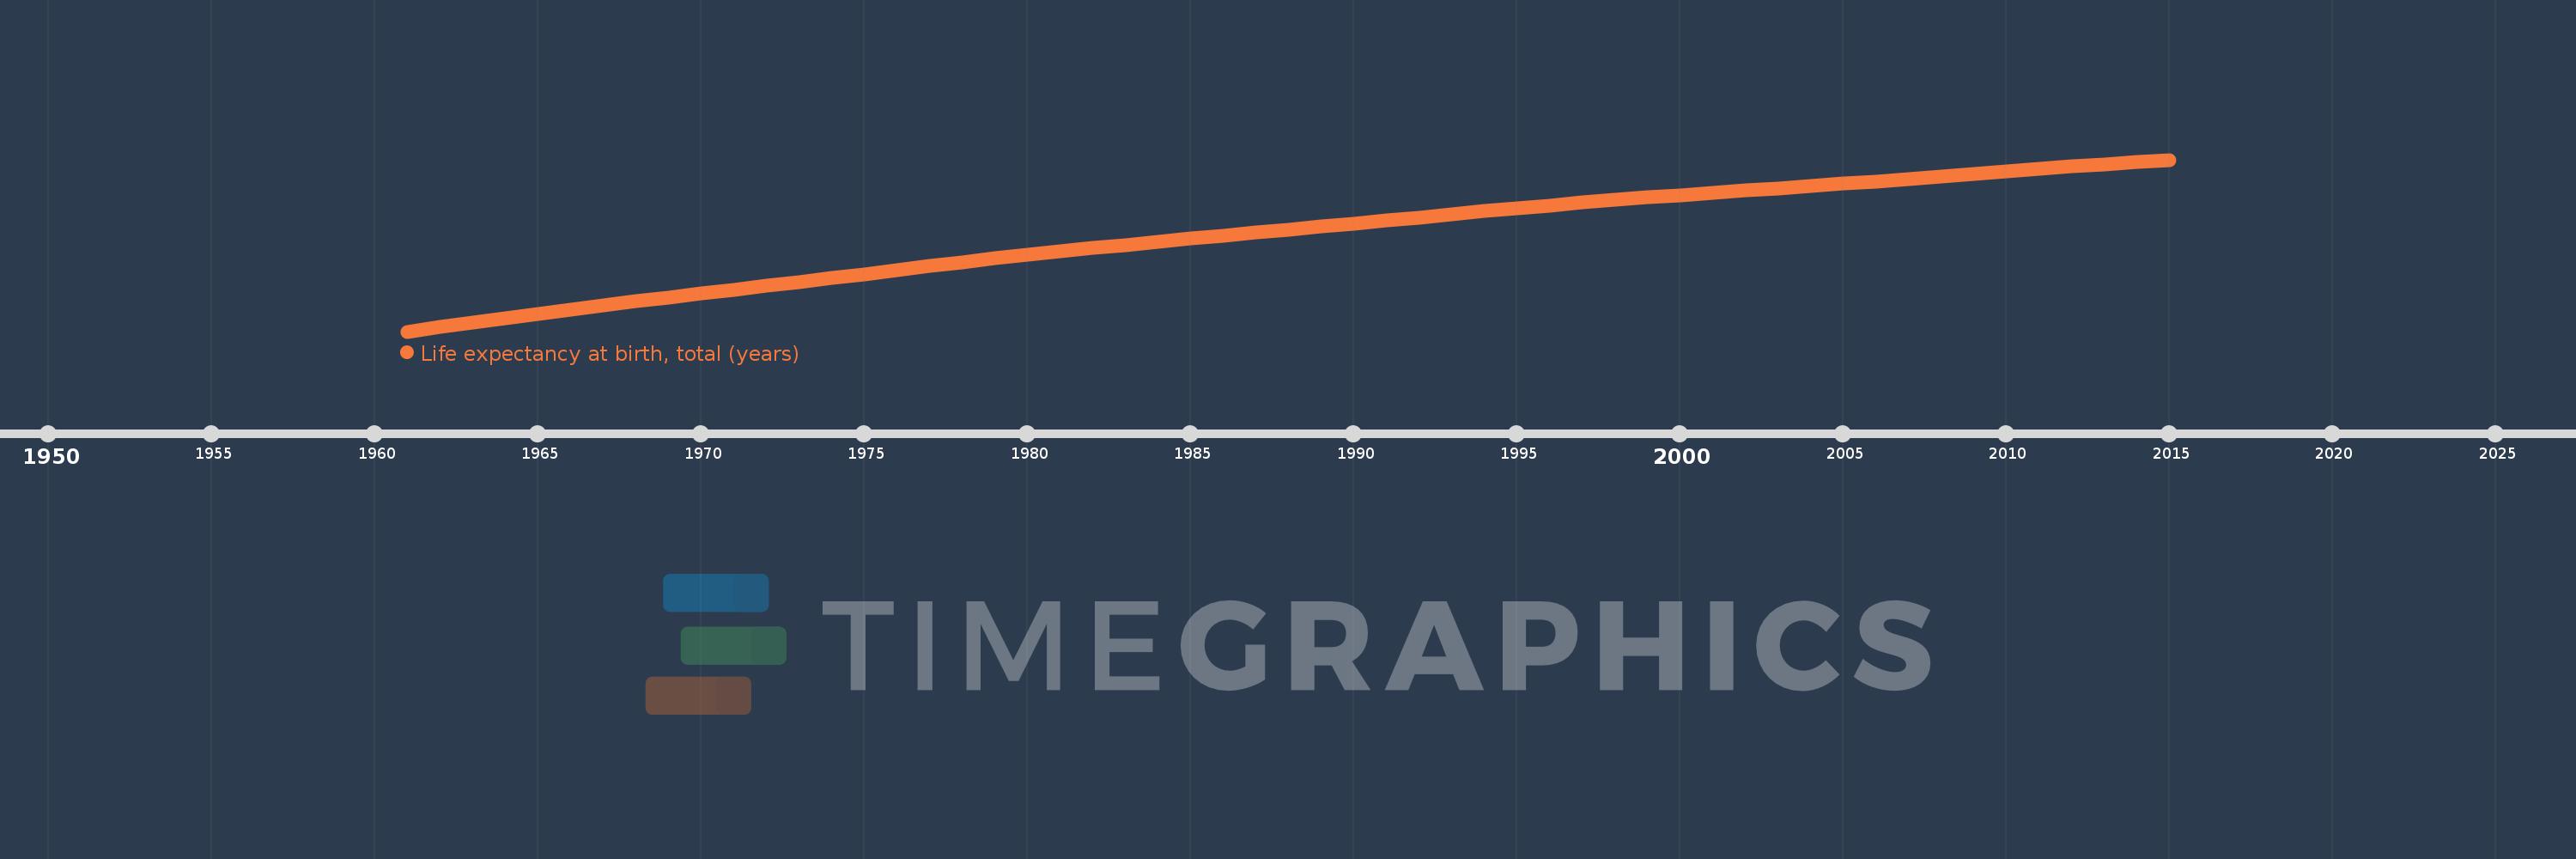
Early-demographic dividend
EAR
false
2
1
Life expectancy at birth, total (years)
2015,2014,2013,2012,2011,2010,2009,2008,2007,2006,2005,2004,2003,2002,2001,2000,1999,1998,1997,1996,1995,1994,1993,1992,1991,1990,1989,1988,1987,1986,1985,1984,1983,1982,1981,1980,1979,1978,1977,1976,1975,1974,1973,1972,1971,1970,1969,1968,1967,1966,1965,1964,1963,1962,1961
This statistics in other country:
AfghanistanAlbaniaAlgeriaAngolaAntigua and BarbudaArab WorldArgentinaArmeniaArubaAustraliaAustriaAzerbaijanBahamas, TheBahrainBangladeshBarbadosBelarusBelgiumBelizeBeninBermudaBhutanBoliviaBosnia and HerzegovinaBotswanaBrazilBrunei DarussalamBulgariaBurkina FasoBurundiCabo VerdeCambodiaCameroonCanadaCaribbean small statesCentral African RepublicCentral Europe and the BalticsChadChannel IslandsChileChinaColombiaComorosCongo, Dem. Rep.Congo, Rep.Costa RicaCote d'IvoireCroatiaCubaCuracaoCyprusCzech RepublicDenmarkDjiboutiDominicaDominican RepublicEarly-demographic dividendEast Asia & PacificEast Asia & Pacific (excluding high income)East Asia & Pacific (IDA & IBRD countries)EcuadorEgypt, Arab Rep.El SalvadorEquatorial GuineaEritreaEstoniaEthiopiaEuro areaEurope & Central AsiaEurope & Central Asia (excluding high income)Europe & Central Asia (IDA & IBRD countries)European UnionFaroe IslandsFijiFinlandFragile and conflict affected situationsFranceFrench PolynesiaGabonGambia, TheGeorgiaGermanyGhanaGreeceGreenlandGrenadaGuamGuatemalaGuineaGuinea-BissauGuyanaHaitiHeavily indebted poor countries (HIPC)High incomeHondurasHong Kong SAR, ChinaHungaryIBRD onlyIcelandIDA & IBRD totalIDA blendIDA onlyIDA totalIndiaIndonesiaIran, Islamic Rep.IraqIrelandIsle of ManIsraelItalyJamaicaJapanJordanKazakhstanKenyaKiribatiKorea, Dem. People’s Rep.Korea, Rep.KosovoKuwaitKyrgyz RepublicLao PDRLate-demographic dividendLatin America & Caribbean Latin America & Caribbean (excluding high income)Latin America & the Caribbean (IDA & IBRD countries)LatviaLeast developed countries: UN classificationLebanonLesothoLiberiaLibyaLiechtensteinLithuaniaLow & middle incomeLow incomeLower middle incomeLuxembourgMacao SAR, ChinaMacedonia, FYRMadagascarMalawiMalaysiaMaldivesMaliMaltaMarshall IslandsMauritaniaMauritiusMexicoMicronesia, Fed. Sts.Middle East & North AfricaMiddle East & North Africa (excluding high income)Middle East & North Africa (IDA & IBRD countries)Middle incomeMoldovaMongoliaMontenegroMoroccoMozambiqueMyanmarNamibiaNepalNetherlandsNew CaledoniaNew ZealandNicaraguaNigerNigeriaNorth AmericaNorwayOECD membersOmanOther small statesPacific island small statesPakistanPalauPanamaPapua New GuineaParaguayPeruPhilippinesPolandPortugalPost-demographic dividendPre-demographic dividendPuerto RicoQatarRomaniaRussian FederationRwandaSamoaSan MarinoSao Tome and PrincipeSaudi ArabiaSenegalSerbiaSeychellesSierra LeoneSingaporeSint Maarten (Dutch part)Slovak RepublicSloveniaSmall statesSolomon IslandsSomaliaSouth AfricaSouth AsiaSouth Asia (IDA & IBRD)South SudanSpainSri LankaSt. Kitts and NevisSt. LuciaSt. Martin (French part)St. Vincent and the GrenadinesSub-Saharan Africa Sub-Saharan Africa (excluding high income)Sub-Saharan Africa (IDA & IBRD countries)SudanSurinameSwazilandSwedenSwitzerlandSyrian Arab RepublicTajikistanTanzaniaThailandTimor-LesteTogoTongaTrinidad and TobagoTunisiaTurkeyTurkmenistanUgandaUkraineUnited Arab EmiratesUnited KingdomUnited StatesUpper middle incomeUruguayUzbekistanVanuatuVenezuela, RBVietnamVirgin Islands (U.S.)West Bank and GazaWorldYemen, Rep.ZambiaZimbabwe Timeline:
This timeline shows a graph from 1961 to 2015 of Early-demographic dividend. No data until 1960. Number of actual observations by date: 55.
Source name:
World Development Indicators
Source organization:
Derived from male and female life expectancy at birth from sources such as: (1) United Nations Population Division. World Population Prospects, (2) Census reports and other statistical publications from national statistical offices, (3) Eurostat: Demographic Statistics, (4) United Nations Statistical Division. Population and Vital Statistics Reprot (various years), (5) U.S. Census Bureau: International Database, and (6) Secretariat of the Pacific Community: Statistics and Demography Programme.
Categories, topics:
Health
Last updated:
apr 23, 2017
Indicators value changes by year
Minimum:
45.147
jan 1, 1961
Maximum:
69.039
jan 1, 2015
At the date of observation
Value
Absolute change
Change from previous value
jan 1, 1961
45.147
+45.147
0.0%
jan 1, 1962
45.816
+0.669
1.48%
jan 1, 1963
46.426
+0.61
1.33%
jan 1, 1964
46.975
+0.549
1.18%
jan 1, 1965
47.579
+0.604
1.28%
jan 1, 1966
48.175
+0.596
1.25%
jan 1, 1967
48.813
+0.638
1.32%
jan 1, 1968
49.377
+0.565
1.16%
jan 1, 1969
49.924
+0.546
1.11%
jan 1, 1970
50.455
+0.532
1.06%
jan 1, 1971
50.979
+0.524
1.04%
jan 1, 1972
51.503
+0.524
1.03%
jan 1, 1973
52.031
+0.528
1.03%
jan 1, 1974
52.574
+0.543
1.04%
jan 1, 1975
53.125
+0.551
1.05%
jan 1, 1976
53.683
+0.558
1.05%
jan 1, 1977
54.243
+0.56
1.04%
jan 1, 1978
54.793
+0.55
1.01%
jan 1, 1979
55.325
+0.532
0.97%
jan 1, 1980
55.832
+0.507
0.92%
jan 1, 1981
56.311
+0.479
0.86%
jan 1, 1982
56.765
+0.454
0.81%
jan 1, 1983
57.202
+0.436
0.77%
jan 1, 1984
57.631
+0.43
0.75%
jan 1, 1985
58.057
+0.426
0.74%
jan 1, 1986
58.483
+0.426
0.73%
jan 1, 1987
58.909
+0.426
0.73%
jan 1, 1988
59.335
+0.426
0.72%
jan 1, 1989
59.756
+0.421
0.71%
jan 1, 1990
60.181
+0.425
0.71%
jan 1, 1991
60.61
+0.429
0.71%
jan 1, 1992
61.035
+0.425
0.7%
jan 1, 1993
61.46
+0.425
0.7%
jan 1, 1994
61.885
+0.425
0.69%
jan 1, 1995
62.301
+0.416
0.67%
jan 1, 1996
62.702
+0.402
0.64%
jan 1, 1997
63.087
+0.385
0.61%
jan 1, 1998
63.451
+0.364
0.58%
jan 1, 1999
63.797
+0.346
0.55%
jan 1, 2000
64.128
+0.331
0.52%
jan 1, 2001
64.446
+0.318
0.5%
jan 1, 2002
64.757
+0.311
0.48%
jan 1, 2003
65.067
+0.31
0.48%
jan 1, 2004
65.381
+0.314
0.48%
jan 1, 2005
65.702
+0.321
0.49%
jan 1, 2006
66.03
+0.328
0.5%
jan 1, 2007
66.37
+0.34
0.52%
jan 1, 2008
66.717
+0.347
0.52%
jan 1, 2009
67.068
+0.351
0.53%
jan 1, 2010
67.419
+0.351
0.52%
jan 1, 2011
67.765
+0.346
0.51%
jan 1, 2012
68.103
+0.337
0.5%
jan 1, 2013
68.429
+0.326
0.48%
jan 1, 2014
68.742
+0.313
0.46%
jan 1, 2015
69.039
+0.297
0.43%
Ranking of countries by current statistics by years


Comments: