29
/
en
AIzaSyAYiBZKx7MnpbEhh9jyipgxe19OcubqV5w
April 1, 2024
210612
Nicaragua
NIC
true
2
1
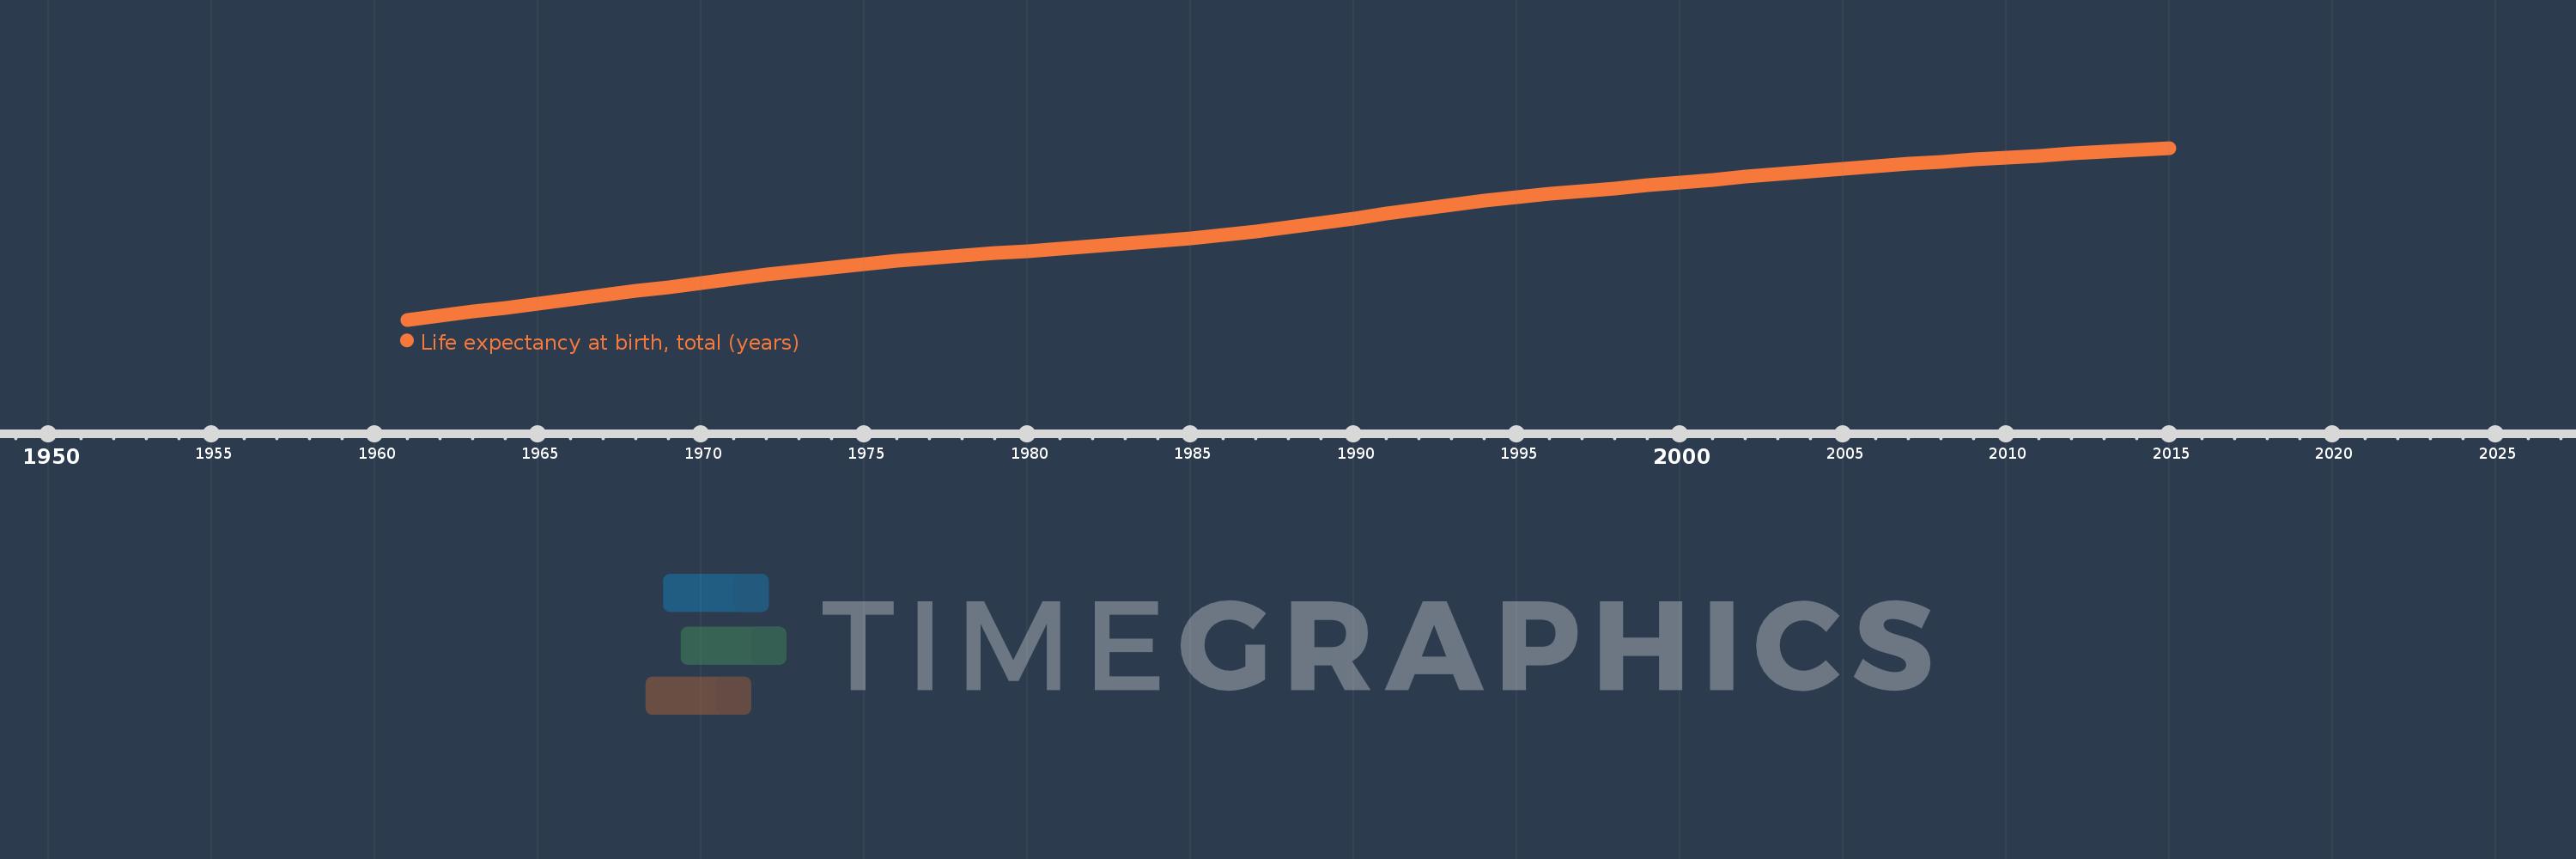
Life expectancy at birth, total (years)
2015,2014,2013,2012,2011,2010,2009,2008,2007,2006,2005,2004,2003,2002,2001,2000,1999,1998,1997,1996,1995,1994,1993,1992,1991,1990,1989,1988,1987,1986,1985,1984,1983,1982,1981,1980,1979,1978,1977,1976,1975,1974,1973,1972,1971,1970,1969,1968,1967,1966,1965,1964,1963,1962,1961
This statistics in other country:
AfghanistanAlbaniaAlgeriaAngolaAntigua and BarbudaArab WorldArgentinaArmeniaArubaAustraliaAustriaAzerbaijanBahamas, TheBahrainBangladeshBarbadosBelarusBelgiumBelizeBeninBermudaBhutanBoliviaBosnia and HerzegovinaBotswanaBrazilBrunei DarussalamBulgariaBurkina FasoBurundiCabo VerdeCambodiaCameroonCanadaCaribbean small statesCentral African RepublicCentral Europe and the BalticsChadChannel IslandsChileChinaColombiaComorosCongo, Dem. Rep.Congo, Rep.Costa RicaCote d'IvoireCroatiaCubaCuracaoCyprusCzech RepublicDenmarkDjiboutiDominicaDominican RepublicEarly-demographic dividendEast Asia & PacificEast Asia & Pacific (excluding high income)East Asia & Pacific (IDA & IBRD countries)EcuadorEgypt, Arab Rep.El SalvadorEquatorial GuineaEritreaEstoniaEthiopiaEuro areaEurope & Central AsiaEurope & Central Asia (excluding high income)Europe & Central Asia (IDA & IBRD countries)European UnionFaroe IslandsFijiFinlandFragile and conflict affected situationsFranceFrench PolynesiaGabonGambia, TheGeorgiaGermanyGhanaGreeceGreenlandGrenadaGuamGuatemalaGuineaGuinea-BissauGuyanaHaitiHeavily indebted poor countries (HIPC)High incomeHondurasHong Kong SAR, ChinaHungaryIBRD onlyIcelandIDA & IBRD totalIDA blendIDA onlyIDA totalIndiaIndonesiaIran, Islamic Rep.IraqIrelandIsle of ManIsraelItalyJamaicaJapanJordanKazakhstanKenyaKiribatiKorea, Dem. People’s Rep.Korea, Rep.KosovoKuwaitKyrgyz RepublicLao PDRLate-demographic dividendLatin America & Caribbean Latin America & Caribbean (excluding high income)Latin America & the Caribbean (IDA & IBRD countries)LatviaLeast developed countries: UN classificationLebanonLesothoLiberiaLibyaLiechtensteinLithuaniaLow & middle incomeLow incomeLower middle incomeLuxembourgMacao SAR, ChinaMacedonia, FYRMadagascarMalawiMalaysiaMaldivesMaliMaltaMarshall IslandsMauritaniaMauritiusMexicoMicronesia, Fed. Sts.Middle East & North AfricaMiddle East & North Africa (excluding high income)Middle East & North Africa (IDA & IBRD countries)Middle incomeMoldovaMongoliaMontenegroMoroccoMozambiqueMyanmarNamibiaNepalNetherlandsNew CaledoniaNew ZealandNicaraguaNigerNigeriaNorth AmericaNorwayOECD membersOmanOther small statesPacific island small statesPakistanPalauPanamaPapua New GuineaParaguayPeruPhilippinesPolandPortugalPost-demographic dividendPre-demographic dividendPuerto RicoQatarRomaniaRussian FederationRwandaSamoaSan MarinoSao Tome and PrincipeSaudi ArabiaSenegalSerbiaSeychellesSierra LeoneSingaporeSint Maarten (Dutch part)Slovak RepublicSloveniaSmall statesSolomon IslandsSomaliaSouth AfricaSouth AsiaSouth Asia (IDA & IBRD)South SudanSpainSri LankaSt. Kitts and NevisSt. LuciaSt. Martin (French part)St. Vincent and the GrenadinesSub-Saharan Africa Sub-Saharan Africa (excluding high income)Sub-Saharan Africa (IDA & IBRD countries)SudanSurinameSwazilandSwedenSwitzerlandSyrian Arab RepublicTajikistanTanzaniaThailandTimor-LesteTogoTongaTrinidad and TobagoTunisiaTurkeyTurkmenistanUgandaUkraineUnited Arab EmiratesUnited KingdomUnited StatesUpper middle incomeUruguayUzbekistanVanuatuVenezuela, RBVietnamVirgin Islands (U.S.)West Bank and GazaWorldYemen, Rep.ZambiaZimbabwe Timeline:
This timeline shows a graph from 1961 to 2015 of Nicaragua. No data until 1960. Number of actual observations by date: 55.
Source name:
World Development Indicators
Source organization:
Derived from male and female life expectancy at birth from sources such as: (1) United Nations Population Division. World Population Prospects, (2) Census reports and other statistical publications from national statistical offices, (3) Eurostat: Demographic Statistics, (4) United Nations Statistical Division. Population and Vital Statistics Reprot (various years), (5) U.S. Census Bureau: International Database, and (6) Secretariat of the Pacific Community: Statistics and Demography Programme.
Categories, topics:
Health
Last updated:
apr 23, 2017
Indicators value changes by year
Minimum:
46.999
jan 1, 1961
At the date of observation
Value
Absolute change
Change from previous value
jan 1, 1961
46.999
+46.999
0.0%
jan 1, 1962
47.646
+0.647
1.38%
jan 1, 1963
48.296
+0.65
1.36%
jan 1, 1964
48.951
+0.655
1.36%
jan 1, 1965
49.608
+0.658
1.34%
jan 1, 1966
50.271
+0.663
1.34%
jan 1, 1967
50.941
+0.671
1.33%
jan 1, 1968
51.62
+0.678
1.33%
jan 1, 1969
52.301
+0.681
1.32%
jan 1, 1970
52.978
+0.677
1.29%
jan 1, 1971
53.644
+0.666
1.26%
jan 1, 1972
54.287
+0.643
1.2%
jan 1, 1973
54.899
+0.612
1.13%
jan 1, 1974
55.476
+0.577
1.05%
jan 1, 1975
56.013
+0.538
0.97%
jan 1, 1976
56.509
+0.495
0.88%
jan 1, 1977
56.958
+0.449
0.79%
jan 1, 1978
57.37
+0.412
0.72%
jan 1, 1979
57.757
+0.387
0.67%
jan 1, 1980
58.128
+0.371
0.64%
jan 1, 1981
58.497
+0.369
0.63%
jan 1, 1982
58.873
+0.376
0.64%
jan 1, 1983
59.267
+0.393
0.67%
jan 1, 1984
59.689
+0.423
0.71%
jan 1, 1985
60.15
+0.461
0.77%
jan 1, 1986
60.668
+0.517
0.86%
jan 1, 1987
61.255
+0.587
0.97%
jan 1, 1988
61.91
+0.655
1.07%
jan 1, 1989
62.62
+0.71
1.15%
jan 1, 1990
63.37
+0.751
1.2%
jan 1, 1991
64.135
+0.765
1.21%
jan 1, 1992
64.884
+0.749
1.17%
jan 1, 1993
65.591
+0.707
1.09%
jan 1, 1994
66.239
+0.648
0.99%
jan 1, 1995
66.822
+0.582
0.88%
jan 1, 1996
67.343
+0.521
0.78%
jan 1, 1997
67.818
+0.475
0.71%
jan 1, 1998
68.274
+0.456
0.67%
jan 1, 1999
68.729
+0.455
0.67%
jan 1, 2000
69.19
+0.461
0.67%
jan 1, 2001
69.658
+0.468
0.68%
jan 1, 2002
70.127
+0.469
0.67%
jan 1, 2003
70.586
+0.458
0.65%
jan 1, 2004
71.025
+0.439
0.62%
jan 1, 2005
71.443
+0.418
0.59%
jan 1, 2006
71.838
+0.395
0.55%
jan 1, 2007
72.213
+0.375
0.52%
jan 1, 2008
72.572
+0.359
0.5%
jan 1, 2009
72.918
+0.347
0.48%
jan 1, 2010
73.255
+0.336
0.46%
jan 1, 2011
73.582
+0.327
0.45%
jan 1, 2012
73.901
+0.32
0.43%
jan 1, 2013
74.212
+0.311
0.42%
jan 1, 2014
74.515
+0.302
0.41%
jan 1, 2015
74.81
+0.295
0.4%
Ranking of countries by current statistics by years


Comments: