29
/
en
AIzaSyAYiBZKx7MnpbEhh9jyipgxe19OcubqV5w
April 1, 2024
242806
Slovenia
SVN
true
2
1
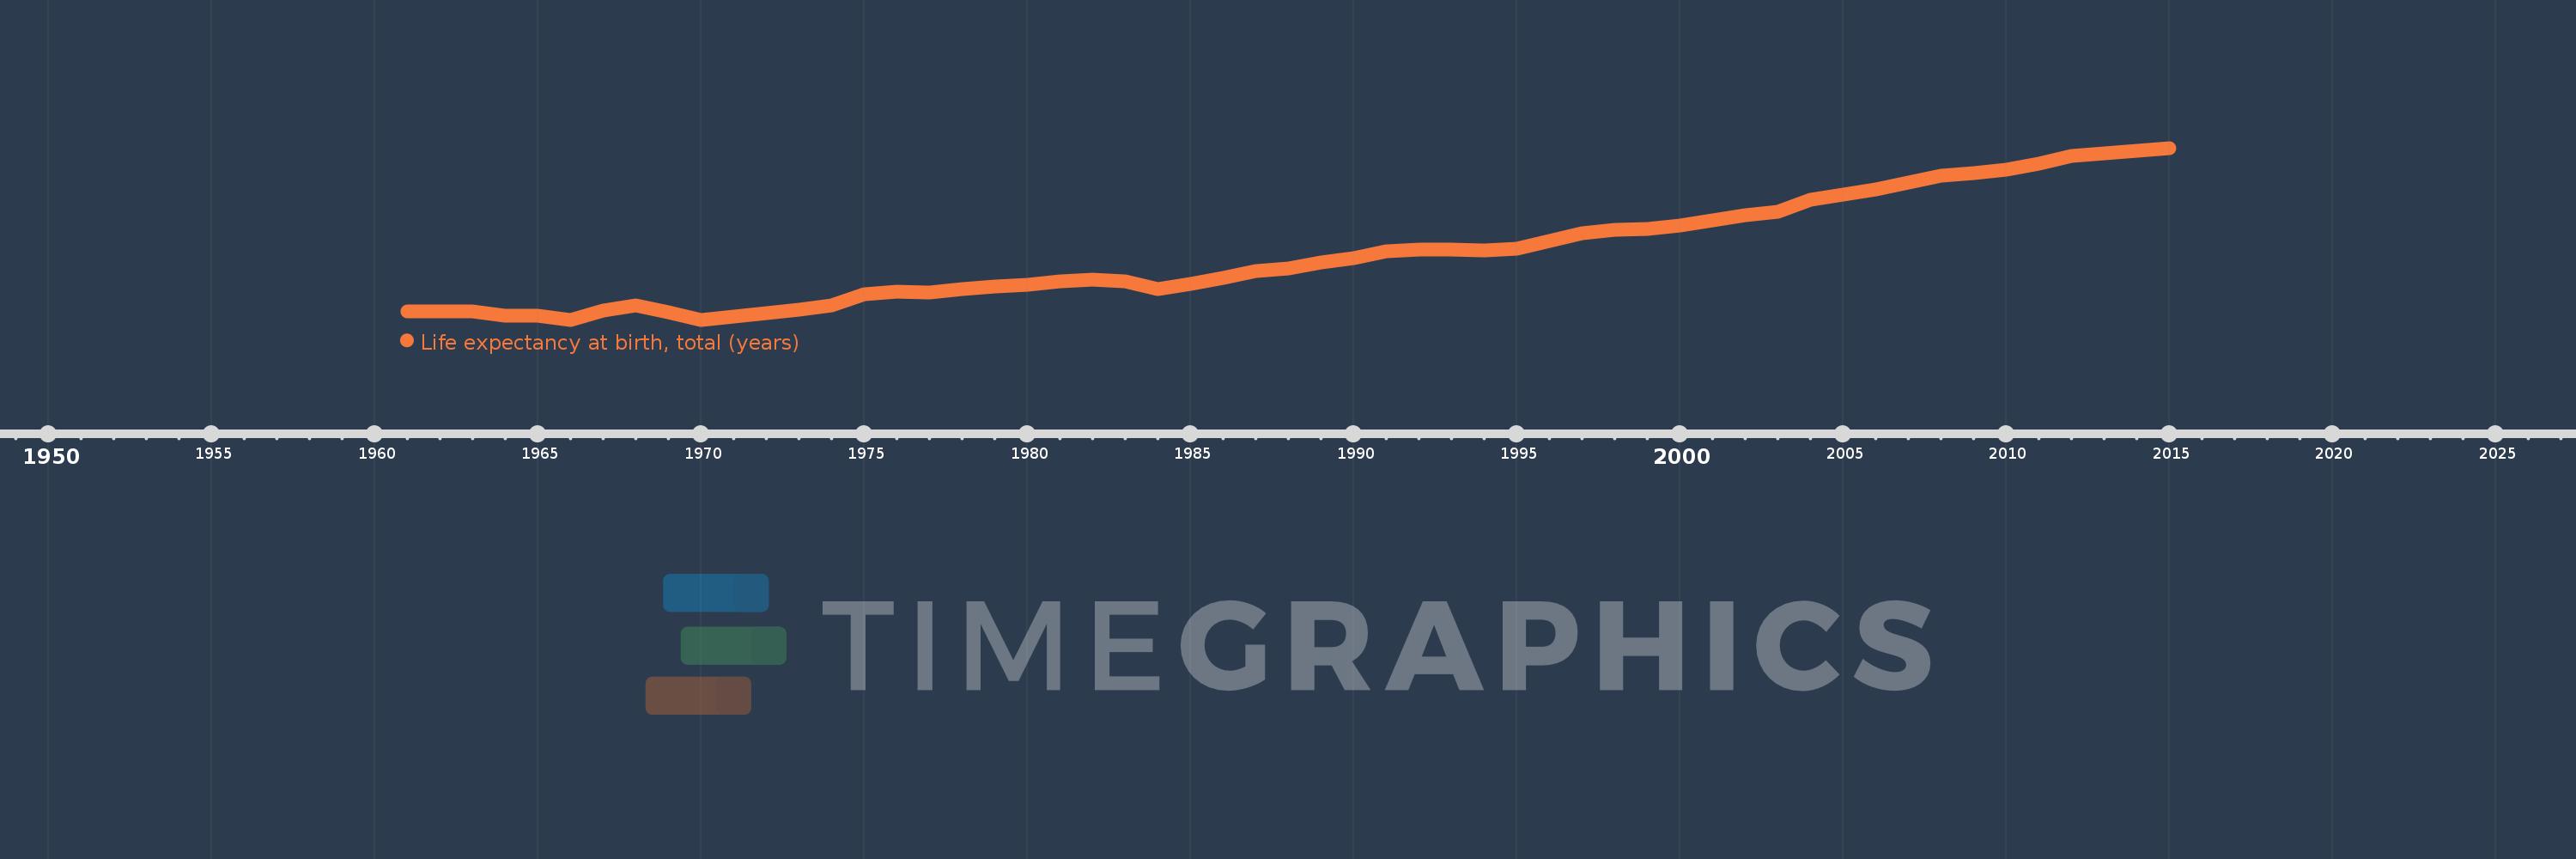
Life expectancy at birth, total (years)
2015,2014,2013,2012,2011,2010,2009,2008,2007,2006,2005,2004,2003,2002,2001,2000,1999,1998,1997,1996,1995,1994,1993,1992,1991,1990,1989,1988,1987,1986,1985,1984,1983,1982,1981,1980,1979,1978,1977,1976,1975,1974,1973,1972,1971,1970,1969,1968,1967,1966,1965,1964,1963,1962,1961
This statistics in other country:
AfghanistanAlbaniaAlgeriaAngolaAntigua and BarbudaArab WorldArgentinaArmeniaArubaAustraliaAustriaAzerbaijanBahamas, TheBahrainBangladeshBarbadosBelarusBelgiumBelizeBeninBermudaBhutanBoliviaBosnia and HerzegovinaBotswanaBrazilBrunei DarussalamBulgariaBurkina FasoBurundiCabo VerdeCambodiaCameroonCanadaCaribbean small statesCentral African RepublicCentral Europe and the BalticsChadChannel IslandsChileChinaColombiaComorosCongo, Dem. Rep.Congo, Rep.Costa RicaCote d'IvoireCroatiaCubaCuracaoCyprusCzech RepublicDenmarkDjiboutiDominicaDominican RepublicEarly-demographic dividendEast Asia & PacificEast Asia & Pacific (excluding high income)East Asia & Pacific (IDA & IBRD countries)EcuadorEgypt, Arab Rep.El SalvadorEquatorial GuineaEritreaEstoniaEthiopiaEuro areaEurope & Central AsiaEurope & Central Asia (excluding high income)Europe & Central Asia (IDA & IBRD countries)European UnionFaroe IslandsFijiFinlandFragile and conflict affected situationsFranceFrench PolynesiaGabonGambia, TheGeorgiaGermanyGhanaGreeceGreenlandGrenadaGuamGuatemalaGuineaGuinea-BissauGuyanaHaitiHeavily indebted poor countries (HIPC)High incomeHondurasHong Kong SAR, ChinaHungaryIBRD onlyIcelandIDA & IBRD totalIDA blendIDA onlyIDA totalIndiaIndonesiaIran, Islamic Rep.IraqIrelandIsle of ManIsraelItalyJamaicaJapanJordanKazakhstanKenyaKiribatiKorea, Dem. People’s Rep.Korea, Rep.KosovoKuwaitKyrgyz RepublicLao PDRLate-demographic dividendLatin America & Caribbean Latin America & Caribbean (excluding high income)Latin America & the Caribbean (IDA & IBRD countries)LatviaLeast developed countries: UN classificationLebanonLesothoLiberiaLibyaLiechtensteinLithuaniaLow & middle incomeLow incomeLower middle incomeLuxembourgMacao SAR, ChinaMacedonia, FYRMadagascarMalawiMalaysiaMaldivesMaliMaltaMarshall IslandsMauritaniaMauritiusMexicoMicronesia, Fed. Sts.Middle East & North AfricaMiddle East & North Africa (excluding high income)Middle East & North Africa (IDA & IBRD countries)Middle incomeMoldovaMongoliaMontenegroMoroccoMozambiqueMyanmarNamibiaNepalNetherlandsNew CaledoniaNew ZealandNicaraguaNigerNigeriaNorth AmericaNorwayOECD membersOmanOther small statesPacific island small statesPakistanPalauPanamaPapua New GuineaParaguayPeruPhilippinesPolandPortugalPost-demographic dividendPre-demographic dividendPuerto RicoQatarRomaniaRussian FederationRwandaSamoaSan MarinoSao Tome and PrincipeSaudi ArabiaSenegalSerbiaSeychellesSierra LeoneSingaporeSint Maarten (Dutch part)Slovak RepublicSloveniaSmall statesSolomon IslandsSomaliaSouth AfricaSouth AsiaSouth Asia (IDA & IBRD)South SudanSpainSri LankaSt. Kitts and NevisSt. LuciaSt. Martin (French part)St. Vincent and the GrenadinesSub-Saharan Africa Sub-Saharan Africa (excluding high income)Sub-Saharan Africa (IDA & IBRD countries)SudanSurinameSwazilandSwedenSwitzerlandSyrian Arab RepublicTajikistanTanzaniaThailandTimor-LesteTogoTongaTrinidad and TobagoTunisiaTurkeyTurkmenistanUgandaUkraineUnited Arab EmiratesUnited KingdomUnited StatesUpper middle incomeUruguayUzbekistanVanuatuVenezuela, RBVietnamVirgin Islands (U.S.)West Bank and GazaWorldYemen, Rep.ZambiaZimbabwe Timeline:
This timeline shows a graph from 1961 to 2015 of Slovenia. No data until 1960. Number of actual observations by date: 55.
Source name:
World Development Indicators
Source organization:
Derived from male and female life expectancy at birth from sources such as: (1) United Nations Population Division. World Population Prospects, (2) Census reports and other statistical publications from national statistical offices, (3) Eurostat: Demographic Statistics, (4) United Nations Statistical Division. Population and Vital Statistics Reprot (various years), (5) U.S. Census Bureau: International Database, and (6) Secretariat of the Pacific Community: Statistics and Demography Programme.
Categories, topics:
Health
Last updated:
apr 23, 2017
Indicators value changes by year
Minimum:
68.361
jan 1, 1970
At the date of observation
Value
Absolute change
Change from previous value
jan 1, 1961
68.978
+68.978
0.0%
jan 1, 1962
68.978
0.0
0.0%
jan 1, 1963
68.978
0.0
0.0%
jan 1, 1964
68.622
-0.356
-0.52%
jan 1, 1965
68.663
+0.041
0.06%
jan 1, 1966
68.366
-0.298
-0.43%
jan 1, 1967
69.012
+0.646
0.95%
jan 1, 1968
69.366
+0.354
0.51%
jan 1, 1969
68.917
-0.449
-0.65%
jan 1, 1970
68.361
-0.556
-0.81%
jan 1, 1971
68.61
+0.249
0.36%
jan 1, 1972
68.834
+0.224
0.33%
jan 1, 1973
69.059
+0.224
0.33%
jan 1, 1974
69.405
+0.346
0.5%
jan 1, 1975
70.161
+0.756
1.09%
jan 1, 1976
70.359
+0.198
0.28%
jan 1, 1977
70.307
-0.051
-0.07%
jan 1, 1978
70.556
+0.249
0.35%
jan 1, 1979
70.702
+0.146
0.21%
jan 1, 1980
70.854
+0.151
0.21%
jan 1, 1981
71.105
+0.251
0.35%
jan 1, 1982
71.205
+0.1
0.14%
jan 1, 1983
71.054
-0.151
-0.21%
jan 1, 1984
70.541
-0.512
-0.72%
jan 1, 1985
70.902
+0.361
0.51%
jan 1, 1986
71.351
+0.449
0.63%
jan 1, 1987
71.802
+0.451
0.63%
jan 1, 1988
72.002
+0.2
0.28%
jan 1, 1989
72.446
+0.444
0.62%
jan 1, 1990
72.705
+0.259
0.36%
jan 1, 1991
73.205
+0.5
0.69%
jan 1, 1992
73.354
+0.149
0.2%
jan 1, 1993
73.305
-0.049
-0.07%
jan 1, 1994
73.254
-0.051
-0.07%
jan 1, 1995
73.405
+0.151
0.21%
jan 1, 1996
73.959
+0.554
0.75%
jan 1, 1997
74.459
+0.5
0.68%
jan 1, 1998
74.707
+0.249
0.33%
jan 1, 1999
74.807
+0.1
0.13%
jan 1, 2000
75.01
+0.202
0.27%
jan 1, 2001
75.412
+0.402
0.54%
jan 1, 2002
75.759
+0.346
0.46%
jan 1, 2003
76.007
+0.249
0.33%
jan 1, 2004
76.859
+0.851
1.12%
jan 1, 2005
77.207
+0.349
0.45%
jan 1, 2006
77.612
+0.405
0.52%
jan 1, 2007
78.087
+0.474
0.61%
jan 1, 2008
78.561
+0.474
0.61%
jan 1, 2009
78.766
+0.205
0.26%
jan 1, 2010
78.971
+0.205
0.26%
jan 1, 2011
79.422
+0.451
0.57%
jan 1, 2012
79.971
+0.549
0.69%
jan 1, 2013
80.124
+0.154
0.19%
jan 1, 2014
80.322
+0.198
0.25%
jan 1, 2015
80.52
+0.198
0.25%
Ranking of countries by current statistics by years


Comments: