29
/
en
AIzaSyAYiBZKx7MnpbEhh9jyipgxe19OcubqV5w
April 1, 2024
190469
Mali
MLI
true
2
1
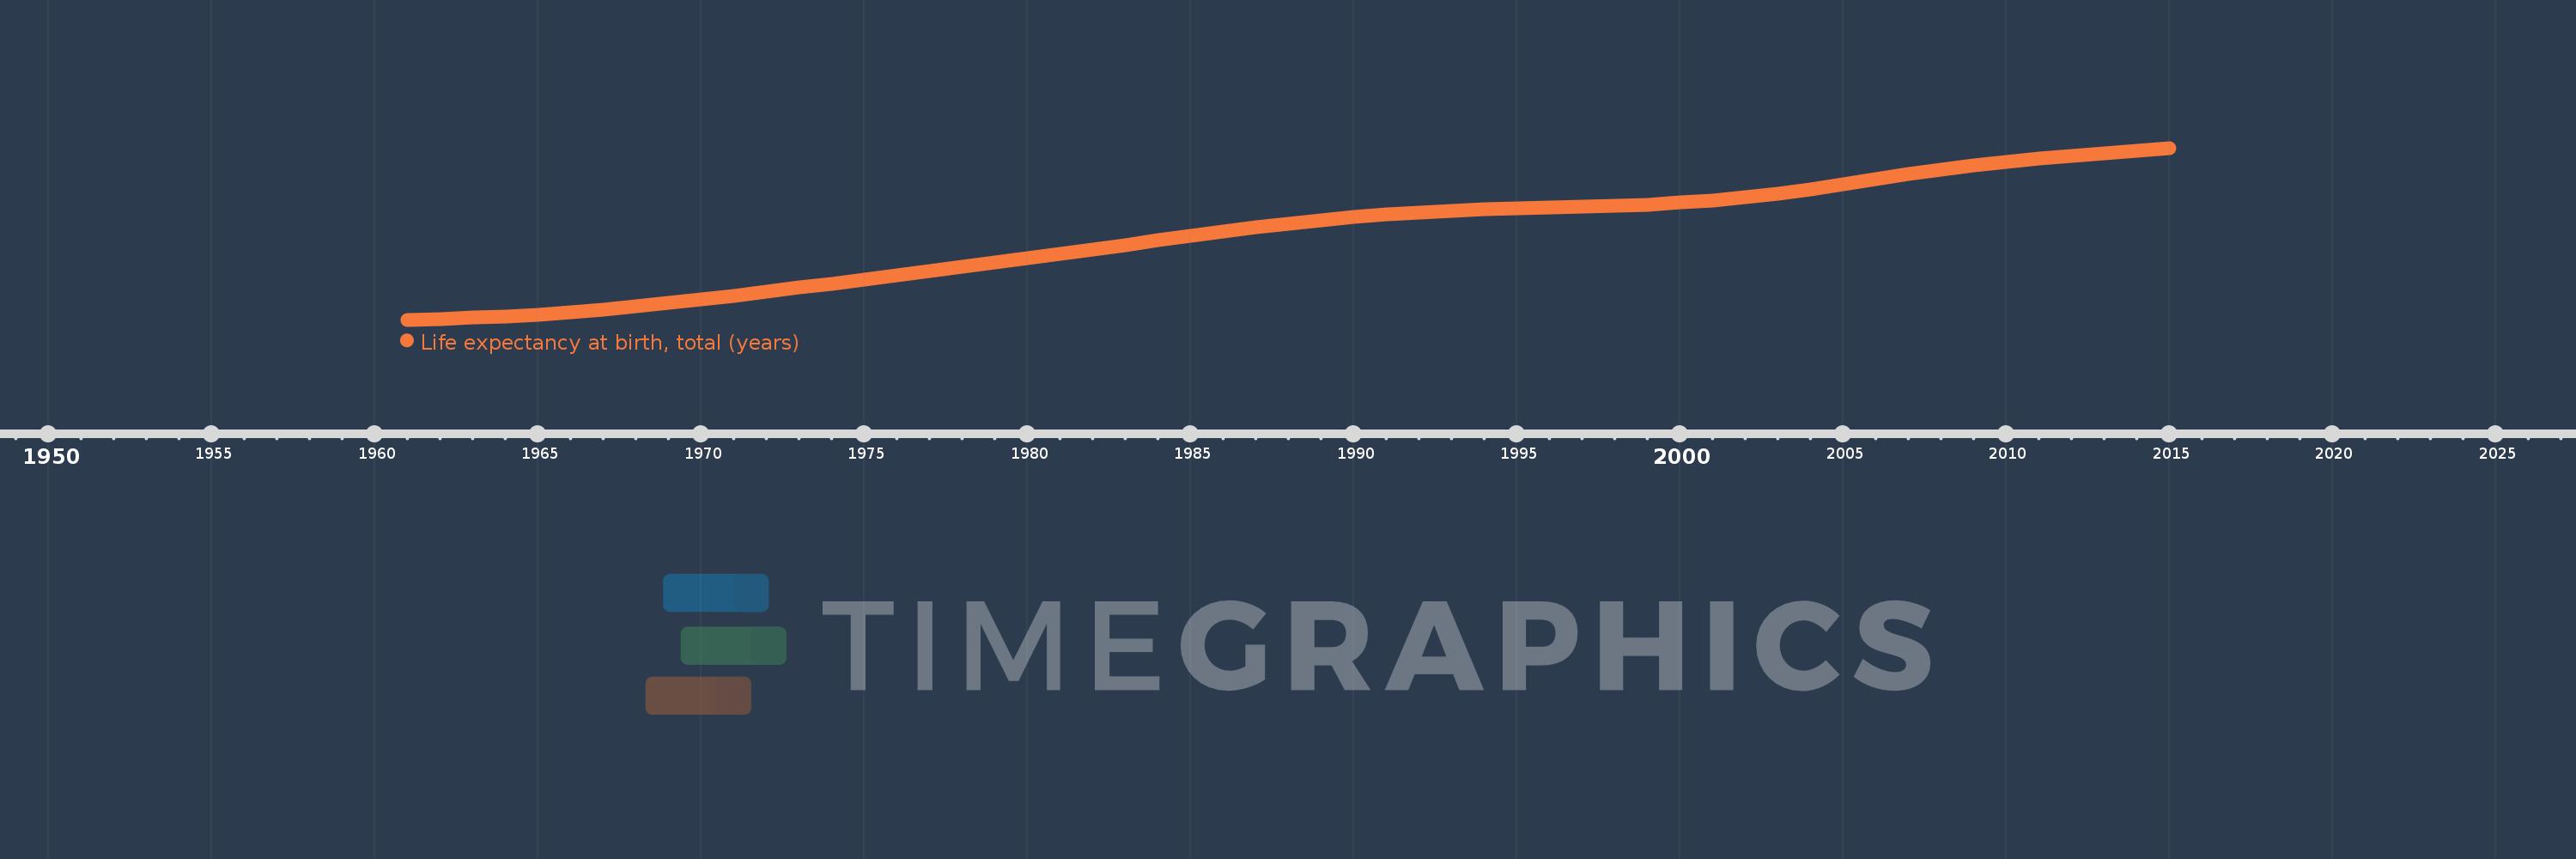
Life expectancy at birth, total (years)
2015,2014,2013,2012,2011,2010,2009,2008,2007,2006,2005,2004,2003,2002,2001,2000,1999,1998,1997,1996,1995,1994,1993,1992,1991,1990,1989,1988,1987,1986,1985,1984,1983,1982,1981,1980,1979,1978,1977,1976,1975,1974,1973,1972,1971,1970,1969,1968,1967,1966,1965,1964,1963,1962,1961
This statistics in other country:
AfghanistanAlbaniaAlgeriaAngolaAntigua and BarbudaArab WorldArgentinaArmeniaArubaAustraliaAustriaAzerbaijanBahamas, TheBahrainBangladeshBarbadosBelarusBelgiumBelizeBeninBermudaBhutanBoliviaBosnia and HerzegovinaBotswanaBrazilBrunei DarussalamBulgariaBurkina FasoBurundiCabo VerdeCambodiaCameroonCanadaCaribbean small statesCentral African RepublicCentral Europe and the BalticsChadChannel IslandsChileChinaColombiaComorosCongo, Dem. Rep.Congo, Rep.Costa RicaCote d'IvoireCroatiaCubaCuracaoCyprusCzech RepublicDenmarkDjiboutiDominicaDominican RepublicEarly-demographic dividendEast Asia & PacificEast Asia & Pacific (excluding high income)East Asia & Pacific (IDA & IBRD countries)EcuadorEgypt, Arab Rep.El SalvadorEquatorial GuineaEritreaEstoniaEthiopiaEuro areaEurope & Central AsiaEurope & Central Asia (excluding high income)Europe & Central Asia (IDA & IBRD countries)European UnionFaroe IslandsFijiFinlandFragile and conflict affected situationsFranceFrench PolynesiaGabonGambia, TheGeorgiaGermanyGhanaGreeceGreenlandGrenadaGuamGuatemalaGuineaGuinea-BissauGuyanaHaitiHeavily indebted poor countries (HIPC)High incomeHondurasHong Kong SAR, ChinaHungaryIBRD onlyIcelandIDA & IBRD totalIDA blendIDA onlyIDA totalIndiaIndonesiaIran, Islamic Rep.IraqIrelandIsle of ManIsraelItalyJamaicaJapanJordanKazakhstanKenyaKiribatiKorea, Dem. People’s Rep.Korea, Rep.KosovoKuwaitKyrgyz RepublicLao PDRLate-demographic dividendLatin America & Caribbean Latin America & Caribbean (excluding high income)Latin America & the Caribbean (IDA & IBRD countries)LatviaLeast developed countries: UN classificationLebanonLesothoLiberiaLibyaLiechtensteinLithuaniaLow & middle incomeLow incomeLower middle incomeLuxembourgMacao SAR, ChinaMacedonia, FYRMadagascarMalawiMalaysiaMaldivesMaliMaltaMarshall IslandsMauritaniaMauritiusMexicoMicronesia, Fed. Sts.Middle East & North AfricaMiddle East & North Africa (excluding high income)Middle East & North Africa (IDA & IBRD countries)Middle incomeMoldovaMongoliaMontenegroMoroccoMozambiqueMyanmarNamibiaNepalNetherlandsNew CaledoniaNew ZealandNicaraguaNigerNigeriaNorth AmericaNorwayOECD membersOmanOther small statesPacific island small statesPakistanPalauPanamaPapua New GuineaParaguayPeruPhilippinesPolandPortugalPost-demographic dividendPre-demographic dividendPuerto RicoQatarRomaniaRussian FederationRwandaSamoaSan MarinoSao Tome and PrincipeSaudi ArabiaSenegalSerbiaSeychellesSierra LeoneSingaporeSint Maarten (Dutch part)Slovak RepublicSloveniaSmall statesSolomon IslandsSomaliaSouth AfricaSouth AsiaSouth Asia (IDA & IBRD)South SudanSpainSri LankaSt. Kitts and NevisSt. LuciaSt. Martin (French part)St. Vincent and the GrenadinesSub-Saharan Africa Sub-Saharan Africa (excluding high income)Sub-Saharan Africa (IDA & IBRD countries)SudanSurinameSwazilandSwedenSwitzerlandSyrian Arab RepublicTajikistanTanzaniaThailandTimor-LesteTogoTongaTrinidad and TobagoTunisiaTurkeyTurkmenistanUgandaUkraineUnited Arab EmiratesUnited KingdomUnited StatesUpper middle incomeUruguayUzbekistanVanuatuVenezuela, RBVietnamVirgin Islands (U.S.)West Bank and GazaWorldYemen, Rep.ZambiaZimbabwe Timeline:
This timeline shows a graph from 1961 to 2015 of Mali. No data until 1960. Number of actual observations by date: 55.
Source name:
World Development Indicators
Source organization:
Derived from male and female life expectancy at birth from sources such as: (1) United Nations Population Division. World Population Prospects, (2) Census reports and other statistical publications from national statistical offices, (3) Eurostat: Demographic Statistics, (4) United Nations Statistical Division. Population and Vital Statistics Reprot (various years), (5) U.S. Census Bureau: International Database, and (6) Secretariat of the Pacific Community: Statistics and Demography Programme.
Categories, topics:
Health
Last updated:
apr 23, 2017
Indicators value changes by year
Minimum:
28.212
jan 1, 1961
Maximum:
57.986
jan 1, 2015
At the date of observation
Value
Absolute change
Change from previous value
jan 1, 1961
28.212
+28.212
0.0%
jan 1, 1962
28.359
+0.147
0.52%
jan 1, 1963
28.548
+0.19
0.67%
jan 1, 1964
28.796
+0.248
0.87%
jan 1, 1965
29.111
+0.315
1.09%
jan 1, 1966
29.502
+0.391
1.34%
jan 1, 1967
29.971
+0.469
1.59%
jan 1, 1968
30.506
+0.535
1.78%
jan 1, 1969
31.094
+0.588
1.93%
jan 1, 1970
31.726
+0.633
2.03%
jan 1, 1971
32.393
+0.667
2.1%
jan 1, 1972
33.082
+0.689
2.13%
jan 1, 1973
33.785
+0.703
2.13%
jan 1, 1974
34.494
+0.709
2.1%
jan 1, 1975
35.205
+0.711
2.06%
jan 1, 1976
35.918
+0.712
2.02%
jan 1, 1977
36.633
+0.715
1.99%
jan 1, 1978
37.359
+0.726
1.98%
jan 1, 1979
38.098
+0.74
1.98%
jan 1, 1980
38.849
+0.751
1.97%
jan 1, 1981
39.613
+0.764
1.97%
jan 1, 1982
40.391
+0.778
1.96%
jan 1, 1983
41.177
+0.786
1.95%
jan 1, 1984
41.962
+0.785
1.91%
jan 1, 1985
42.734
+0.772
1.84%
jan 1, 1986
43.481
+0.747
1.75%
jan 1, 1987
44.191
+0.71
1.63%
jan 1, 1988
44.853
+0.663
1.5%
jan 1, 1989
45.459
+0.606
1.35%
jan 1, 1990
46.001
+0.542
1.19%
jan 1, 1991
46.465
+0.463
1.01%
jan 1, 1992
46.837
+0.372
0.8%
jan 1, 1993
47.123
+0.287
0.61%
jan 1, 1994
47.342
+0.219
0.46%
jan 1, 1995
47.512
+0.169
0.36%
jan 1, 1996
47.655
+0.143
0.3%
jan 1, 1997
47.797
+0.142
0.3%
jan 1, 1998
47.966
+0.169
0.35%
jan 1, 1999
48.189
+0.223
0.46%
jan 1, 2000
48.489
+0.3
0.62%
jan 1, 2001
48.896
+0.407
0.84%
jan 1, 2002
49.435
+0.539
1.1%
jan 1, 2003
50.096
+0.661
1.34%
jan 1, 2004
50.86
+0.763
1.52%
jan 1, 2005
51.701
+0.841
1.65%
jan 1, 2006
52.58
+0.879
1.7%
jan 1, 2007
53.447
+0.867
1.65%
jan 1, 2008
54.262
+0.815
1.53%
jan 1, 2009
54.995
+0.733
1.35%
jan 1, 2010
55.633
+0.638
1.16%
jan 1, 2011
56.18
+0.546
0.98%
jan 1, 2012
56.655
+0.475
0.85%
jan 1, 2013
57.095
+0.44
0.78%
jan 1, 2014
57.535
+0.44
0.77%
jan 1, 2015
57.986
+0.451
0.78%
Ranking of countries by current statistics by years


Comments: