29
/
en
AIzaSyAYiBZKx7MnpbEhh9jyipgxe19OcubqV5w
April 1, 2024
88779
Bosnia and Herzegovina
BIH
true
2
1
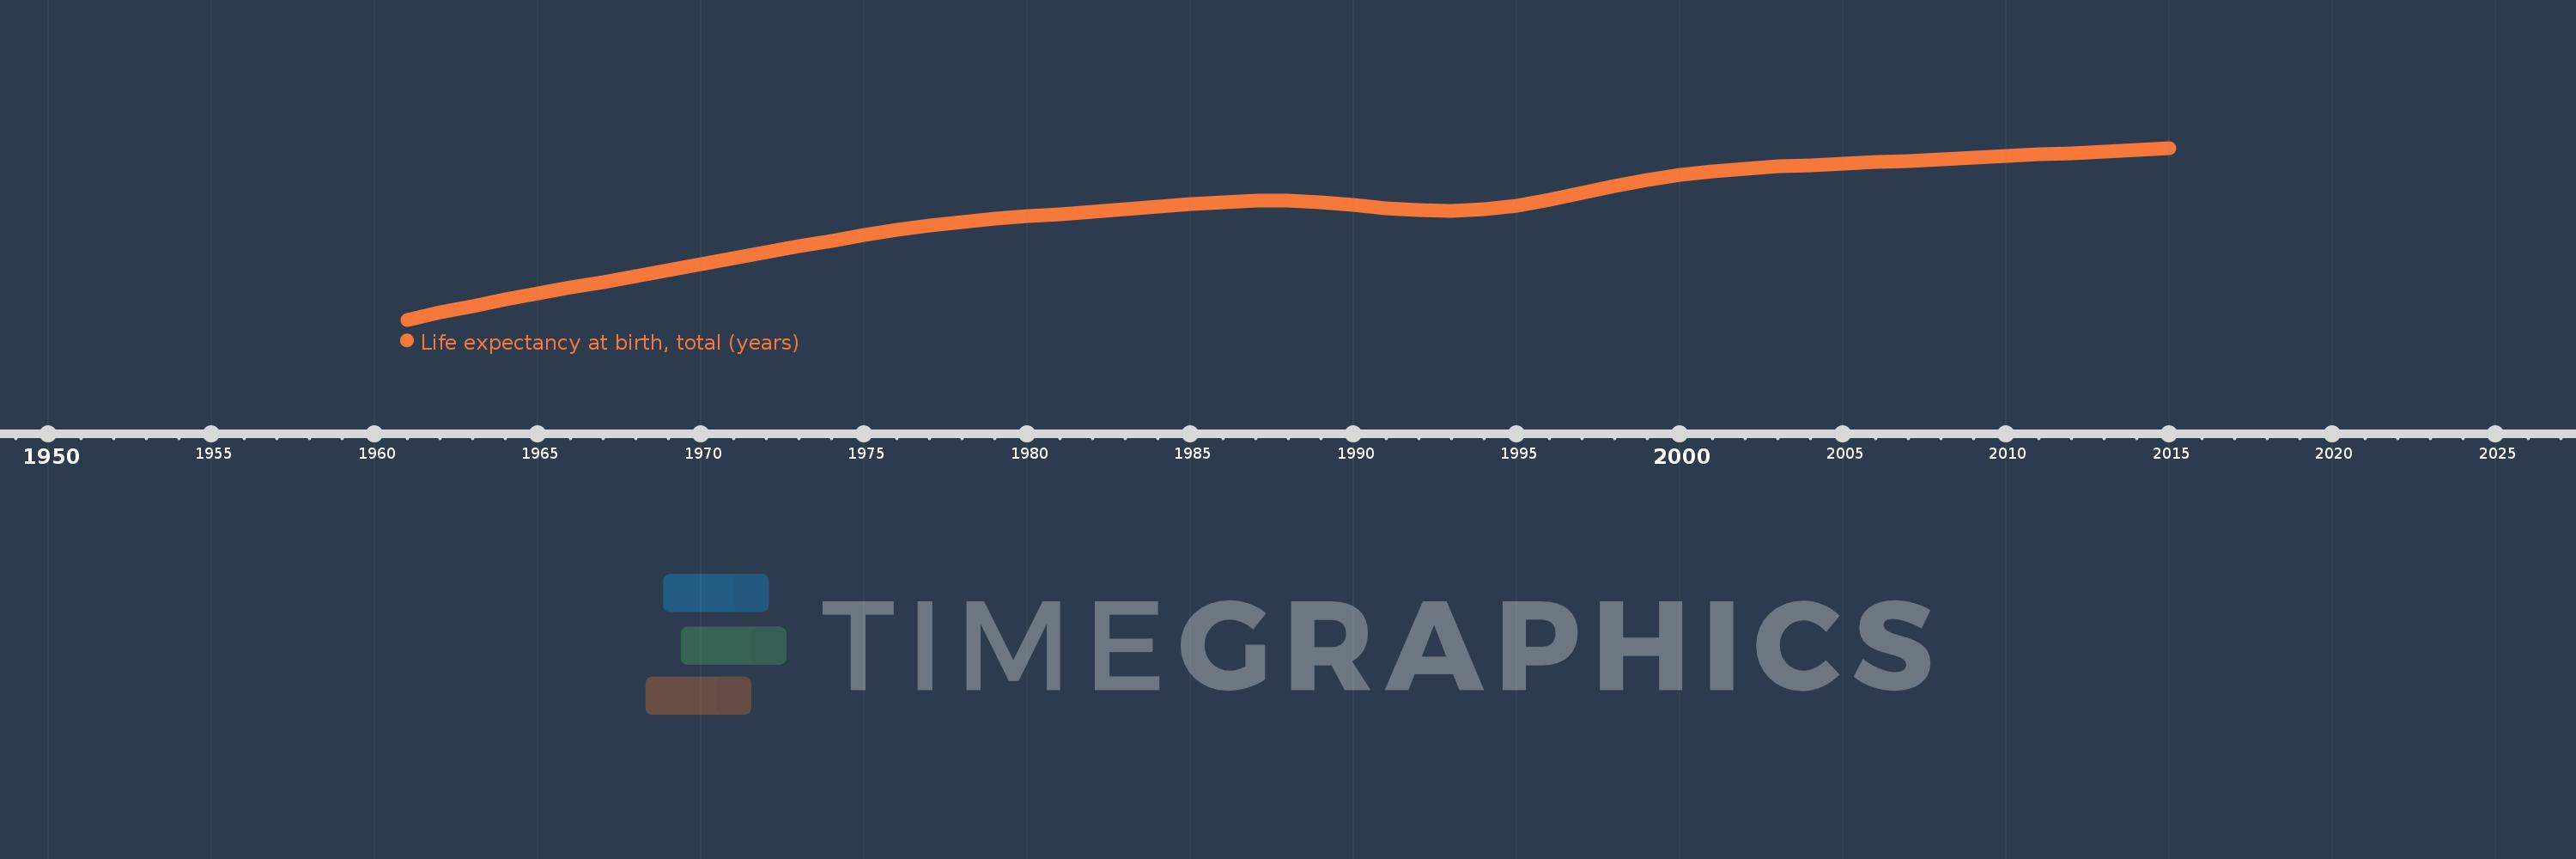
Life expectancy at birth, total (years)
2015,2014,2013,2012,2011,2010,2009,2008,2007,2006,2005,2004,2003,2002,2001,2000,1999,1998,1997,1996,1995,1994,1993,1992,1991,1990,1989,1988,1987,1986,1985,1984,1983,1982,1981,1980,1979,1978,1977,1976,1975,1974,1973,1972,1971,1970,1969,1968,1967,1966,1965,1964,1963,1962,1961
This statistics in other country:
AfghanistanAlbaniaAlgeriaAngolaAntigua and BarbudaArab WorldArgentinaArmeniaArubaAustraliaAustriaAzerbaijanBahamas, TheBahrainBangladeshBarbadosBelarusBelgiumBelizeBeninBermudaBhutanBoliviaBosnia and HerzegovinaBotswanaBrazilBrunei DarussalamBulgariaBurkina FasoBurundiCabo VerdeCambodiaCameroonCanadaCaribbean small statesCentral African RepublicCentral Europe and the BalticsChadChannel IslandsChileChinaColombiaComorosCongo, Dem. Rep.Congo, Rep.Costa RicaCote d'IvoireCroatiaCubaCuracaoCyprusCzech RepublicDenmarkDjiboutiDominicaDominican RepublicEarly-demographic dividendEast Asia & PacificEast Asia & Pacific (excluding high income)East Asia & Pacific (IDA & IBRD countries)EcuadorEgypt, Arab Rep.El SalvadorEquatorial GuineaEritreaEstoniaEthiopiaEuro areaEurope & Central AsiaEurope & Central Asia (excluding high income)Europe & Central Asia (IDA & IBRD countries)European UnionFaroe IslandsFijiFinlandFragile and conflict affected situationsFranceFrench PolynesiaGabonGambia, TheGeorgiaGermanyGhanaGreeceGreenlandGrenadaGuamGuatemalaGuineaGuinea-BissauGuyanaHaitiHeavily indebted poor countries (HIPC)High incomeHondurasHong Kong SAR, ChinaHungaryIBRD onlyIcelandIDA & IBRD totalIDA blendIDA onlyIDA totalIndiaIndonesiaIran, Islamic Rep.IraqIrelandIsle of ManIsraelItalyJamaicaJapanJordanKazakhstanKenyaKiribatiKorea, Dem. People’s Rep.Korea, Rep.KosovoKuwaitKyrgyz RepublicLao PDRLate-demographic dividendLatin America & Caribbean Latin America & Caribbean (excluding high income)Latin America & the Caribbean (IDA & IBRD countries)LatviaLeast developed countries: UN classificationLebanonLesothoLiberiaLibyaLiechtensteinLithuaniaLow & middle incomeLow incomeLower middle incomeLuxembourgMacao SAR, ChinaMacedonia, FYRMadagascarMalawiMalaysiaMaldivesMaliMaltaMarshall IslandsMauritaniaMauritiusMexicoMicronesia, Fed. Sts.Middle East & North AfricaMiddle East & North Africa (excluding high income)Middle East & North Africa (IDA & IBRD countries)Middle incomeMoldovaMongoliaMontenegroMoroccoMozambiqueMyanmarNamibiaNepalNetherlandsNew CaledoniaNew ZealandNicaraguaNigerNigeriaNorth AmericaNorwayOECD membersOmanOther small statesPacific island small statesPakistanPalauPanamaPapua New GuineaParaguayPeruPhilippinesPolandPortugalPost-demographic dividendPre-demographic dividendPuerto RicoQatarRomaniaRussian FederationRwandaSamoaSan MarinoSao Tome and PrincipeSaudi ArabiaSenegalSerbiaSeychellesSierra LeoneSingaporeSint Maarten (Dutch part)Slovak RepublicSloveniaSmall statesSolomon IslandsSomaliaSouth AfricaSouth AsiaSouth Asia (IDA & IBRD)South SudanSpainSri LankaSt. Kitts and NevisSt. LuciaSt. Martin (French part)St. Vincent and the GrenadinesSub-Saharan Africa Sub-Saharan Africa (excluding high income)Sub-Saharan Africa (IDA & IBRD countries)SudanSurinameSwazilandSwedenSwitzerlandSyrian Arab RepublicTajikistanTanzaniaThailandTimor-LesteTogoTongaTrinidad and TobagoTunisiaTurkeyTurkmenistanUgandaUkraineUnited Arab EmiratesUnited KingdomUnited StatesUpper middle incomeUruguayUzbekistanVanuatuVenezuela, RBVietnamVirgin Islands (U.S.)West Bank and GazaWorldYemen, Rep.ZambiaZimbabwe Timeline:
This timeline shows a graph from 1961 to 2015 of Bosnia and Herzegovina. No data until 1960. Number of actual observations by date: 55.
Source name:
World Development Indicators
Source organization:
Derived from male and female life expectancy at birth from sources such as: (1) United Nations Population Division. World Population Prospects, (2) Census reports and other statistical publications from national statistical offices, (3) Eurostat: Demographic Statistics, (4) United Nations Statistical Division. Population and Vital Statistics Reprot (various years), (5) U.S. Census Bureau: International Database, and (6) Secretariat of the Pacific Community: Statistics and Demography Programme.
Categories, topics:
Health
Last updated:
apr 23, 2017
Indicators value changes by year
Minimum:
60.276
jan 1, 1961
Maximum:
76.433
jan 1, 2015
At the date of observation
Value
Absolute change
Change from previous value
jan 1, 1961
60.276
+60.276
0.0%
jan 1, 1962
60.942
+0.665
1.1%
jan 1, 1963
61.568
+0.626
1.03%
jan 1, 1964
62.162
+0.594
0.97%
jan 1, 1965
62.734
+0.571
0.92%
jan 1, 1966
63.292
+0.558
0.89%
jan 1, 1967
63.845
+0.553
0.87%
jan 1, 1968
64.397
+0.552
0.87%
jan 1, 1969
64.95
+0.553
0.86%
jan 1, 1970
65.504
+0.555
0.85%
jan 1, 1971
66.062
+0.557
0.85%
jan 1, 1972
66.621
+0.56
0.85%
jan 1, 1973
67.175
+0.554
0.83%
jan 1, 1974
67.713
+0.538
0.8%
jan 1, 1975
68.227
+0.514
0.76%
jan 1, 1976
68.7
+0.473
0.69%
jan 1, 1977
69.117
+0.417
0.61%
jan 1, 1978
69.473
+0.356
0.52%
jan 1, 1979
69.768
+0.295
0.42%
jan 1, 1980
70.008
+0.24
0.34%
jan 1, 1981
70.214
+0.206
0.29%
jan 1, 1982
70.417
+0.204
0.29%
jan 1, 1983
70.637
+0.22
0.31%
jan 1, 1984
70.879
+0.242
0.34%
jan 1, 1985
71.133
+0.254
0.36%
jan 1, 1986
71.352
+0.219
0.31%
jan 1, 1987
71.474
+0.123
0.17%
jan 1, 1988
71.464
-0.01
-0.01%
jan 1, 1989
71.318
-0.146
-0.2%
jan 1, 1990
71.066
-0.253
-0.35%
jan 1, 1991
70.783
-0.282
-0.4%
jan 1, 1992
70.573
-0.21
-0.3%
jan 1, 1993
70.518
-0.055
-0.08%
jan 1, 1994
70.669
+0.151
0.21%
jan 1, 1995
71.03
+0.36
0.51%
jan 1, 1996
71.566
+0.537
0.76%
jan 1, 1997
72.209
+0.643
0.9%
jan 1, 1998
72.859
+0.65
0.9%
jan 1, 1999
73.437
+0.579
0.79%
jan 1, 2000
73.91
+0.472
0.64%
jan 1, 2001
74.261
+0.351
0.48%
jan 1, 2002
74.501
+0.24
0.32%
jan 1, 2003
74.676
+0.175
0.23%
jan 1, 2004
74.824
+0.149
0.2%
jan 1, 2005
74.959
+0.135
0.18%
jan 1, 2006
75.094
+0.134
0.18%
jan 1, 2007
75.231
+0.138
0.18%
jan 1, 2008
75.371
+0.14
0.19%
jan 1, 2009
75.512
+0.14
0.19%
jan 1, 2010
75.657
+0.145
0.19%
jan 1, 2011
75.808
+0.15
0.2%
jan 1, 2012
75.963
+0.155
0.2%
jan 1, 2013
76.12
+0.157
0.21%
jan 1, 2014
76.277
+0.157
0.21%
jan 1, 2015
76.433
+0.156
0.2%
Ranking of countries by current statistics by years


Comments: