29
/
en
AIzaSyAYiBZKx7MnpbEhh9jyipgxe19OcubqV5w
April 1, 2024
168774
Kiribati
KIR
true
2
1
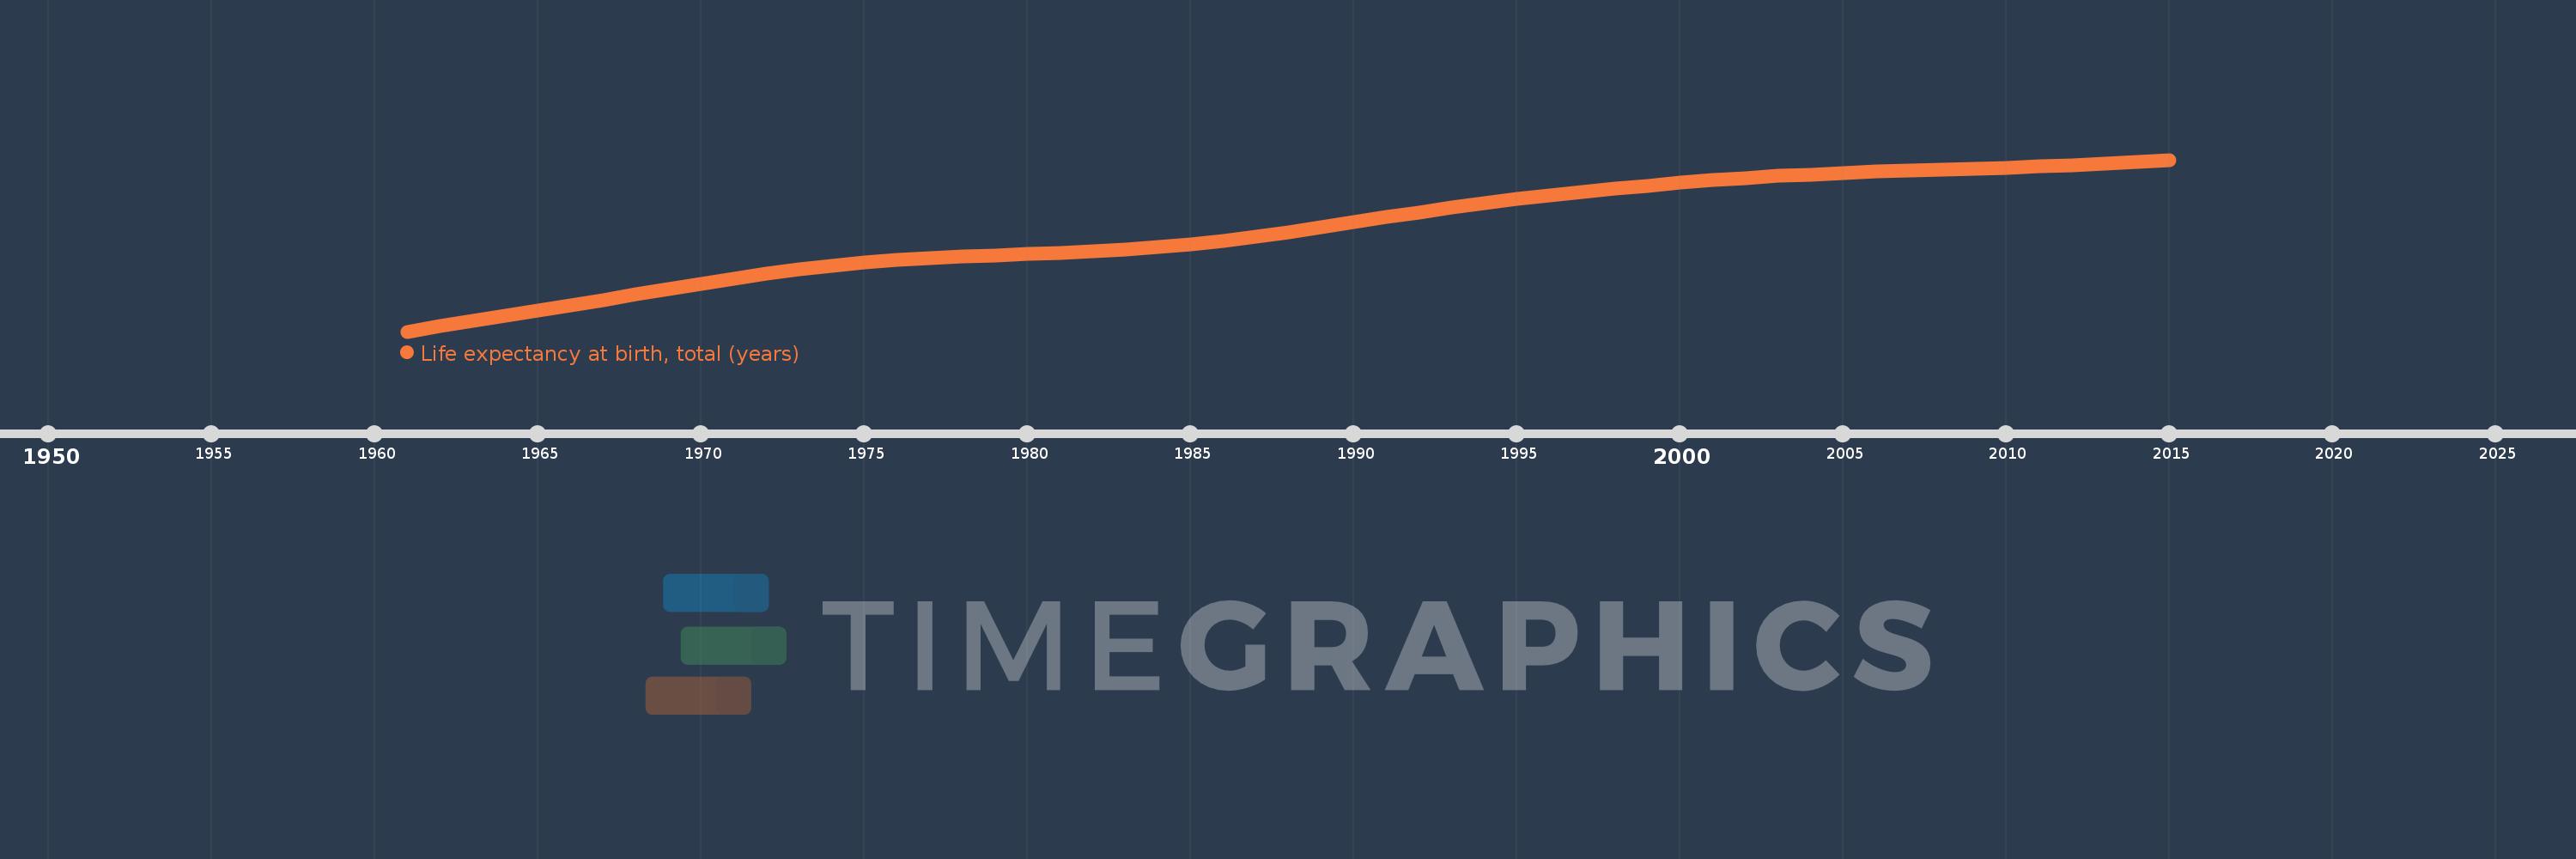
Life expectancy at birth, total (years)
2015,2014,2013,2012,2011,2010,2009,2008,2007,2006,2005,2004,2003,2002,2001,2000,1999,1998,1997,1996,1995,1994,1993,1992,1991,1990,1989,1988,1987,1986,1985,1984,1983,1982,1981,1980,1979,1978,1977,1976,1975,1974,1973,1972,1971,1970,1969,1968,1967,1966,1965,1964,1963,1962,1961
This statistics in other country:
AfghanistanAlbaniaAlgeriaAngolaAntigua and BarbudaArab WorldArgentinaArmeniaArubaAustraliaAustriaAzerbaijanBahamas, TheBahrainBangladeshBarbadosBelarusBelgiumBelizeBeninBermudaBhutanBoliviaBosnia and HerzegovinaBotswanaBrazilBrunei DarussalamBulgariaBurkina FasoBurundiCabo VerdeCambodiaCameroonCanadaCaribbean small statesCentral African RepublicCentral Europe and the BalticsChadChannel IslandsChileChinaColombiaComorosCongo, Dem. Rep.Congo, Rep.Costa RicaCote d'IvoireCroatiaCubaCuracaoCyprusCzech RepublicDenmarkDjiboutiDominicaDominican RepublicEarly-demographic dividendEast Asia & PacificEast Asia & Pacific (excluding high income)East Asia & Pacific (IDA & IBRD countries)EcuadorEgypt, Arab Rep.El SalvadorEquatorial GuineaEritreaEstoniaEthiopiaEuro areaEurope & Central AsiaEurope & Central Asia (excluding high income)Europe & Central Asia (IDA & IBRD countries)European UnionFaroe IslandsFijiFinlandFragile and conflict affected situationsFranceFrench PolynesiaGabonGambia, TheGeorgiaGermanyGhanaGreeceGreenlandGrenadaGuamGuatemalaGuineaGuinea-BissauGuyanaHaitiHeavily indebted poor countries (HIPC)High incomeHondurasHong Kong SAR, ChinaHungaryIBRD onlyIcelandIDA & IBRD totalIDA blendIDA onlyIDA totalIndiaIndonesiaIran, Islamic Rep.IraqIrelandIsle of ManIsraelItalyJamaicaJapanJordanKazakhstanKenyaKiribatiKorea, Dem. People’s Rep.Korea, Rep.KosovoKuwaitKyrgyz RepublicLao PDRLate-demographic dividendLatin America & Caribbean Latin America & Caribbean (excluding high income)Latin America & the Caribbean (IDA & IBRD countries)LatviaLeast developed countries: UN classificationLebanonLesothoLiberiaLibyaLiechtensteinLithuaniaLow & middle incomeLow incomeLower middle incomeLuxembourgMacao SAR, ChinaMacedonia, FYRMadagascarMalawiMalaysiaMaldivesMaliMaltaMarshall IslandsMauritaniaMauritiusMexicoMicronesia, Fed. Sts.Middle East & North AfricaMiddle East & North Africa (excluding high income)Middle East & North Africa (IDA & IBRD countries)Middle incomeMoldovaMongoliaMontenegroMoroccoMozambiqueMyanmarNamibiaNepalNetherlandsNew CaledoniaNew ZealandNicaraguaNigerNigeriaNorth AmericaNorwayOECD membersOmanOther small statesPacific island small statesPakistanPalauPanamaPapua New GuineaParaguayPeruPhilippinesPolandPortugalPost-demographic dividendPre-demographic dividendPuerto RicoQatarRomaniaRussian FederationRwandaSamoaSan MarinoSao Tome and PrincipeSaudi ArabiaSenegalSerbiaSeychellesSierra LeoneSingaporeSint Maarten (Dutch part)Slovak RepublicSloveniaSmall statesSolomon IslandsSomaliaSouth AfricaSouth AsiaSouth Asia (IDA & IBRD)South SudanSpainSri LankaSt. Kitts and NevisSt. LuciaSt. Martin (French part)St. Vincent and the GrenadinesSub-Saharan Africa Sub-Saharan Africa (excluding high income)Sub-Saharan Africa (IDA & IBRD countries)SudanSurinameSwazilandSwedenSwitzerlandSyrian Arab RepublicTajikistanTanzaniaThailandTimor-LesteTogoTongaTrinidad and TobagoTunisiaTurkeyTurkmenistanUgandaUkraineUnited Arab EmiratesUnited KingdomUnited StatesUpper middle incomeUruguayUzbekistanVanuatuVenezuela, RBVietnamVirgin Islands (U.S.)West Bank and GazaWorldYemen, Rep.ZambiaZimbabwe Timeline:
This timeline shows a graph from 1961 to 2015 of Kiribati. No data until 1960. Number of actual observations by date: 55.
Source name:
World Development Indicators
Source organization:
Derived from male and female life expectancy at birth from sources such as: (1) United Nations Population Division. World Population Prospects, (2) Census reports and other statistical publications from national statistical offices, (3) Eurostat: Demographic Statistics, (4) United Nations Statistical Division. Population and Vital Statistics Reprot (various years), (5) U.S. Census Bureau: International Database, and (6) Secretariat of the Pacific Community: Statistics and Demography Programme.
Categories, topics:
Health
Last updated:
apr 23, 2017
Indicators value changes by year
Minimum:
49.216
jan 1, 1961
Maximum:
65.952
jan 1, 2015
At the date of observation
Value
Absolute change
Change from previous value
jan 1, 1961
49.216
+49.216
0.0%
jan 1, 1962
49.744
+0.528
1.07%
jan 1, 1963
50.274
+0.531
1.07%
jan 1, 1964
50.798
+0.523
1.04%
jan 1, 1965
51.308
+0.51
1.0%
jan 1, 1966
51.809
+0.501
0.98%
jan 1, 1967
52.308
+0.499
0.96%
jan 1, 1968
52.815
+0.507
0.97%
jan 1, 1969
53.331
+0.516
0.98%
jan 1, 1970
53.848
+0.517
0.97%
jan 1, 1971
54.351
+0.504
0.94%
jan 1, 1972
54.824
+0.473
0.87%
jan 1, 1973
55.251
+0.427
0.78%
jan 1, 1974
55.622
+0.372
0.67%
jan 1, 1975
55.935
+0.312
0.56%
jan 1, 1976
56.187
+0.252
0.45%
jan 1, 1977
56.379
+0.192
0.34%
jan 1, 1978
56.528
+0.149
0.26%
jan 1, 1979
56.653
+0.125
0.22%
jan 1, 1980
56.769
+0.116
0.21%
jan 1, 1981
56.895
+0.126
0.22%
jan 1, 1982
57.046
+0.151
0.27%
jan 1, 1983
57.234
+0.187
0.33%
jan 1, 1984
57.463
+0.229
0.4%
jan 1, 1985
57.741
+0.278
0.48%
jan 1, 1986
58.075
+0.334
0.58%
jan 1, 1987
58.466
+0.391
0.67%
jan 1, 1988
58.903
+0.437
0.75%
jan 1, 1989
59.37
+0.468
0.79%
jan 1, 1990
59.858
+0.488
0.82%
jan 1, 1991
60.351
+0.492
0.82%
jan 1, 1992
60.835
+0.484
0.8%
jan 1, 1993
61.3
+0.465
0.76%
jan 1, 1994
61.737
+0.438
0.71%
jan 1, 1995
62.14
+0.402
0.65%
jan 1, 1996
62.506
+0.366
0.59%
jan 1, 1997
62.837
+0.332
0.53%
jan 1, 1998
63.145
+0.307
0.49%
jan 1, 1999
63.433
+0.288
0.46%
jan 1, 2000
63.703
+0.27
0.43%
jan 1, 2001
63.951
+0.248
0.39%
jan 1, 2002
64.172
+0.221
0.35%
jan 1, 2003
64.364
+0.192
0.3%
jan 1, 2004
64.527
+0.163
0.25%
jan 1, 2005
64.665
+0.138
0.21%
jan 1, 2006
64.782
+0.117
0.18%
jan 1, 2007
64.885
+0.103
0.16%
jan 1, 2008
64.981
+0.095
0.15%
jan 1, 2009
65.079
+0.098
0.15%
jan 1, 2010
65.183
+0.105
0.16%
jan 1, 2011
65.303
+0.119
0.18%
jan 1, 2012
65.441
+0.138
0.21%
jan 1, 2013
65.596
+0.155
0.24%
jan 1, 2014
65.767
+0.171
0.26%
jan 1, 2015
65.952
+0.185
0.28%
Ranking of countries by current statistics by years


Comments: