29
/
en
AIzaSyAYiBZKx7MnpbEhh9jyipgxe19OcubqV5w
April 1, 2024
223806
Philippines
PHL
true
2
1
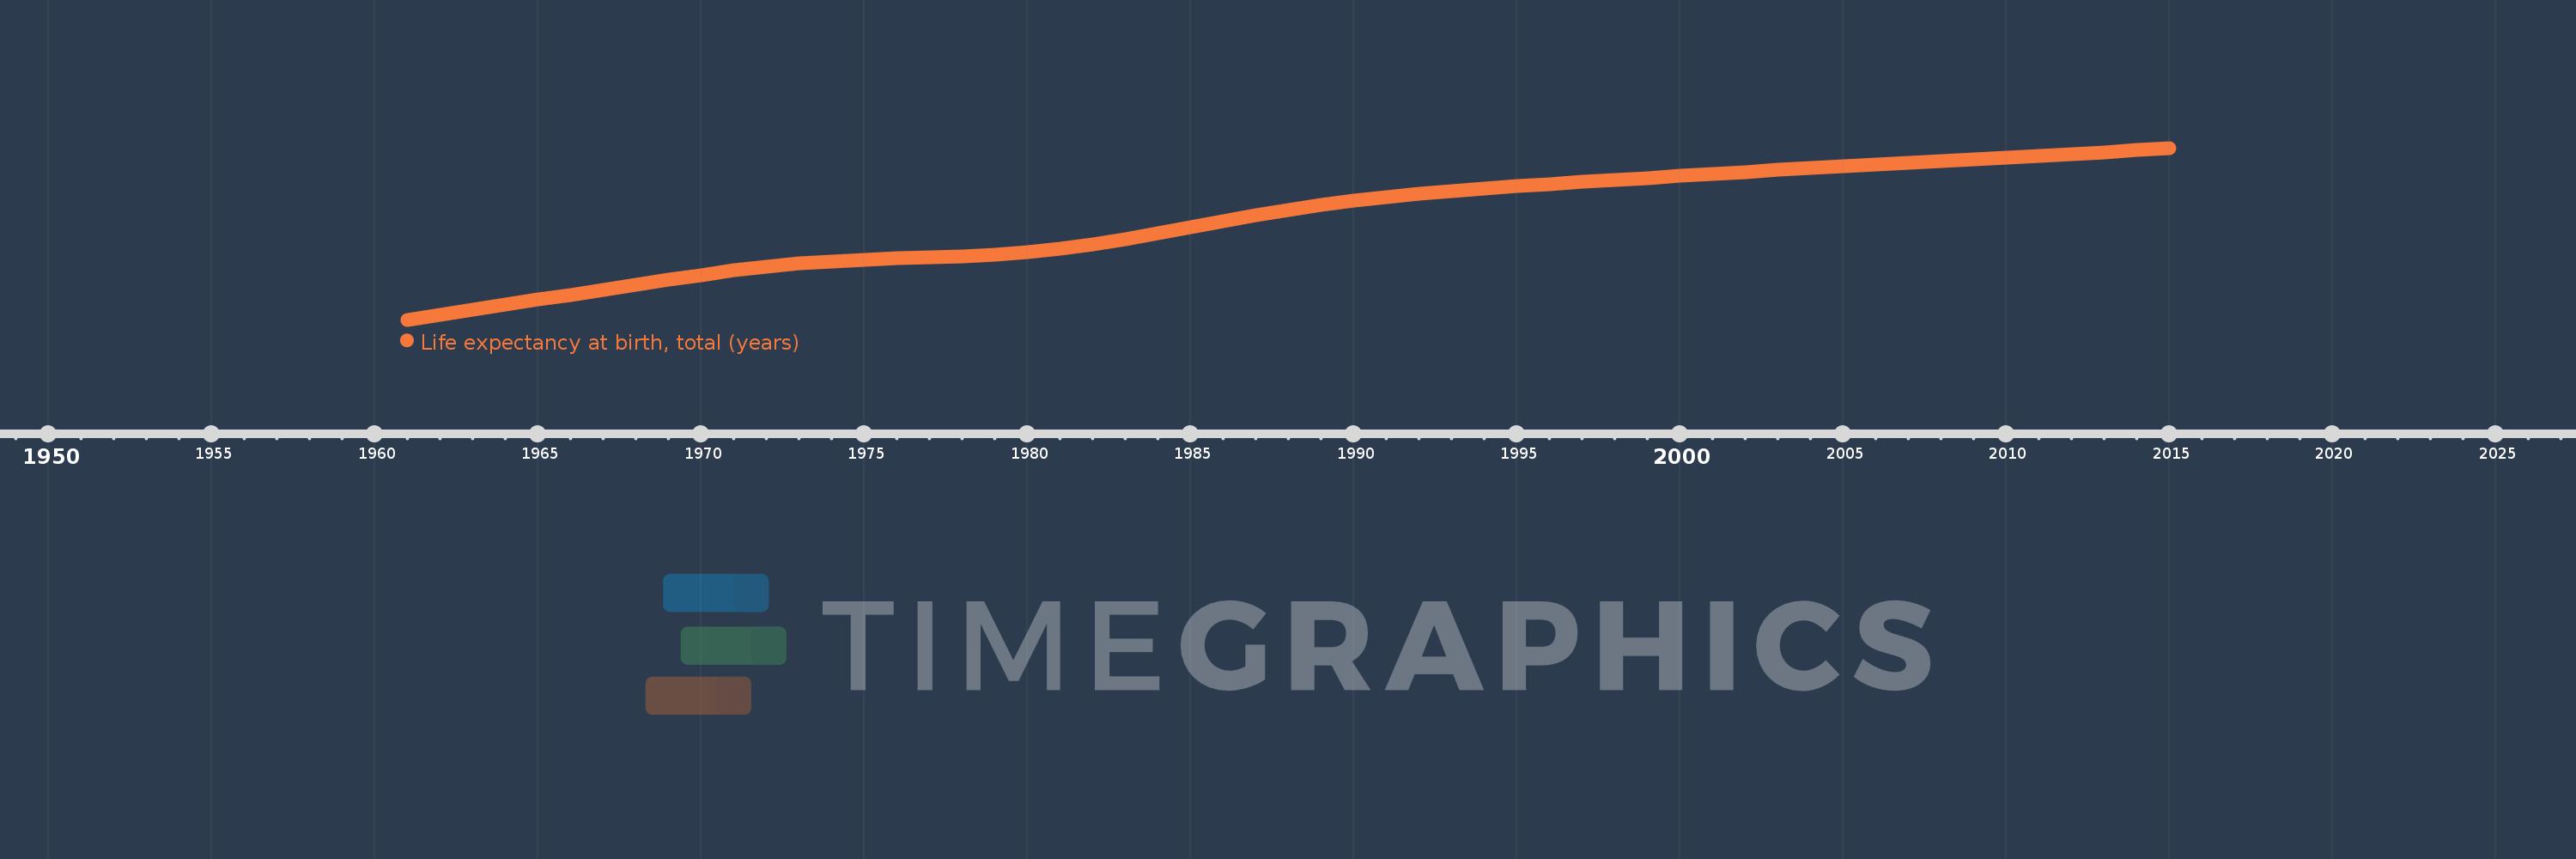
Life expectancy at birth, total (years)
2015,2014,2013,2012,2011,2010,2009,2008,2007,2006,2005,2004,2003,2002,2001,2000,1999,1998,1997,1996,1995,1994,1993,1992,1991,1990,1989,1988,1987,1986,1985,1984,1983,1982,1981,1980,1979,1978,1977,1976,1975,1974,1973,1972,1971,1970,1969,1968,1967,1966,1965,1964,1963,1962,1961
This statistics in other country:
AfghanistanAlbaniaAlgeriaAngolaAntigua and BarbudaArab WorldArgentinaArmeniaArubaAustraliaAustriaAzerbaijanBahamas, TheBahrainBangladeshBarbadosBelarusBelgiumBelizeBeninBermudaBhutanBoliviaBosnia and HerzegovinaBotswanaBrazilBrunei DarussalamBulgariaBurkina FasoBurundiCabo VerdeCambodiaCameroonCanadaCaribbean small statesCentral African RepublicCentral Europe and the BalticsChadChannel IslandsChileChinaColombiaComorosCongo, Dem. Rep.Congo, Rep.Costa RicaCote d'IvoireCroatiaCubaCuracaoCyprusCzech RepublicDenmarkDjiboutiDominicaDominican RepublicEarly-demographic dividendEast Asia & PacificEast Asia & Pacific (excluding high income)East Asia & Pacific (IDA & IBRD countries)EcuadorEgypt, Arab Rep.El SalvadorEquatorial GuineaEritreaEstoniaEthiopiaEuro areaEurope & Central AsiaEurope & Central Asia (excluding high income)Europe & Central Asia (IDA & IBRD countries)European UnionFaroe IslandsFijiFinlandFragile and conflict affected situationsFranceFrench PolynesiaGabonGambia, TheGeorgiaGermanyGhanaGreeceGreenlandGrenadaGuamGuatemalaGuineaGuinea-BissauGuyanaHaitiHeavily indebted poor countries (HIPC)High incomeHondurasHong Kong SAR, ChinaHungaryIBRD onlyIcelandIDA & IBRD totalIDA blendIDA onlyIDA totalIndiaIndonesiaIran, Islamic Rep.IraqIrelandIsle of ManIsraelItalyJamaicaJapanJordanKazakhstanKenyaKiribatiKorea, Dem. People’s Rep.Korea, Rep.KosovoKuwaitKyrgyz RepublicLao PDRLate-demographic dividendLatin America & Caribbean Latin America & Caribbean (excluding high income)Latin America & the Caribbean (IDA & IBRD countries)LatviaLeast developed countries: UN classificationLebanonLesothoLiberiaLibyaLiechtensteinLithuaniaLow & middle incomeLow incomeLower middle incomeLuxembourgMacao SAR, ChinaMacedonia, FYRMadagascarMalawiMalaysiaMaldivesMaliMaltaMarshall IslandsMauritaniaMauritiusMexicoMicronesia, Fed. Sts.Middle East & North AfricaMiddle East & North Africa (excluding high income)Middle East & North Africa (IDA & IBRD countries)Middle incomeMoldovaMongoliaMontenegroMoroccoMozambiqueMyanmarNamibiaNepalNetherlandsNew CaledoniaNew ZealandNicaraguaNigerNigeriaNorth AmericaNorwayOECD membersOmanOther small statesPacific island small statesPakistanPalauPanamaPapua New GuineaParaguayPeruPhilippinesPolandPortugalPost-demographic dividendPre-demographic dividendPuerto RicoQatarRomaniaRussian FederationRwandaSamoaSan MarinoSao Tome and PrincipeSaudi ArabiaSenegalSerbiaSeychellesSierra LeoneSingaporeSint Maarten (Dutch part)Slovak RepublicSloveniaSmall statesSolomon IslandsSomaliaSouth AfricaSouth AsiaSouth Asia (IDA & IBRD)South SudanSpainSri LankaSt. Kitts and NevisSt. LuciaSt. Martin (French part)St. Vincent and the GrenadinesSub-Saharan Africa Sub-Saharan Africa (excluding high income)Sub-Saharan Africa (IDA & IBRD countries)SudanSurinameSwazilandSwedenSwitzerlandSyrian Arab RepublicTajikistanTanzaniaThailandTimor-LesteTogoTongaTrinidad and TobagoTunisiaTurkeyTurkmenistanUgandaUkraineUnited Arab EmiratesUnited KingdomUnited StatesUpper middle incomeUruguayUzbekistanVanuatuVenezuela, RBVietnamVirgin Islands (U.S.)West Bank and GazaWorldYemen, Rep.ZambiaZimbabwe Timeline:
This timeline shows a graph from 1961 to 2015 of Philippines. No data until 1960. Number of actual observations by date: 55.
Source name:
World Development Indicators
Source organization:
Derived from male and female life expectancy at birth from sources such as: (1) United Nations Population Division. World Population Prospects, (2) Census reports and other statistical publications from national statistical offices, (3) Eurostat: Demographic Statistics, (4) United Nations Statistical Division. Population and Vital Statistics Reprot (various years), (5) U.S. Census Bureau: International Database, and (6) Secretariat of the Pacific Community: Statistics and Demography Programme.
Categories, topics:
Health
Last updated:
apr 23, 2017
Indicators value changes by year
Minimum:
57.812
jan 1, 1961
Maximum:
68.266
jan 1, 2015
At the date of observation
Value
Absolute change
Change from previous value
jan 1, 1961
57.812
+57.812
0.0%
jan 1, 1962
58.122
+0.31
0.54%
jan 1, 1963
58.429
+0.307
0.53%
jan 1, 1964
58.733
+0.304
0.52%
jan 1, 1965
59.033
+0.3
0.51%
jan 1, 1966
59.333
+0.3
0.51%
jan 1, 1967
59.636
+0.303
0.51%
jan 1, 1968
59.942
+0.306
0.51%
jan 1, 1969
60.245
+0.303
0.51%
jan 1, 1970
60.54
+0.295
0.49%
jan 1, 1971
60.813
+0.273
0.45%
jan 1, 1972
61.046
+0.233
0.38%
jan 1, 1973
61.231
+0.185
0.3%
jan 1, 1974
61.369
+0.138
0.23%
jan 1, 1975
61.465
+0.096
0.16%
jan 1, 1976
61.536
+0.071
0.12%
jan 1, 1977
61.6
+0.063
0.1%
jan 1, 1978
61.678
+0.078
0.13%
jan 1, 1979
61.79
+0.112
0.18%
jan 1, 1980
61.946
+0.156
0.25%
jan 1, 1981
62.155
+0.209
0.34%
jan 1, 1982
62.421
+0.266
0.43%
jan 1, 1983
62.732
+0.311
0.5%
jan 1, 1984
63.073
+0.341
0.54%
jan 1, 1985
63.433
+0.36
0.57%
jan 1, 1986
63.799
+0.365
0.58%
jan 1, 1987
64.154
+0.355
0.56%
jan 1, 1988
64.488
+0.334
0.52%
jan 1, 1989
64.792
+0.304
0.47%
jan 1, 1990
65.059
+0.268
0.41%
jan 1, 1991
65.288
+0.229
0.35%
jan 1, 1992
65.481
+0.193
0.3%
jan 1, 1993
65.648
+0.167
0.26%
jan 1, 1994
65.8
+0.151
0.23%
jan 1, 1995
65.939
+0.139
0.21%
jan 1, 1996
66.071
+0.132
0.2%
jan 1, 1997
66.198
+0.127
0.19%
jan 1, 1998
66.321
+0.124
0.19%
jan 1, 1999
66.442
+0.121
0.18%
jan 1, 2000
66.562
+0.12
0.18%
jan 1, 2001
66.682
+0.12
0.18%
jan 1, 2002
66.802
+0.12
0.18%
jan 1, 2003
66.922
+0.119
0.18%
jan 1, 2004
67.039
+0.117
0.18%
jan 1, 2005
67.154
+0.115
0.17%
jan 1, 2006
67.266
+0.112
0.17%
jan 1, 2007
67.375
+0.108
0.16%
jan 1, 2008
67.479
+0.104
0.15%
jan 1, 2009
67.581
+0.102
0.15%
jan 1, 2010
67.681
+0.1
0.15%
jan 1, 2011
67.783
+0.102
0.15%
jan 1, 2012
67.891
+0.107
0.16%
jan 1, 2013
68.007
+0.116
0.17%
jan 1, 2014
68.132
+0.124
0.18%
jan 1, 2015
68.266
+0.134
0.2%
Ranking of countries by current statistics by years


Comments: