29
/
en
AIzaSyAYiBZKx7MnpbEhh9jyipgxe19OcubqV5w
April 1, 2024
269568
Turkey
TUR
true
2
1
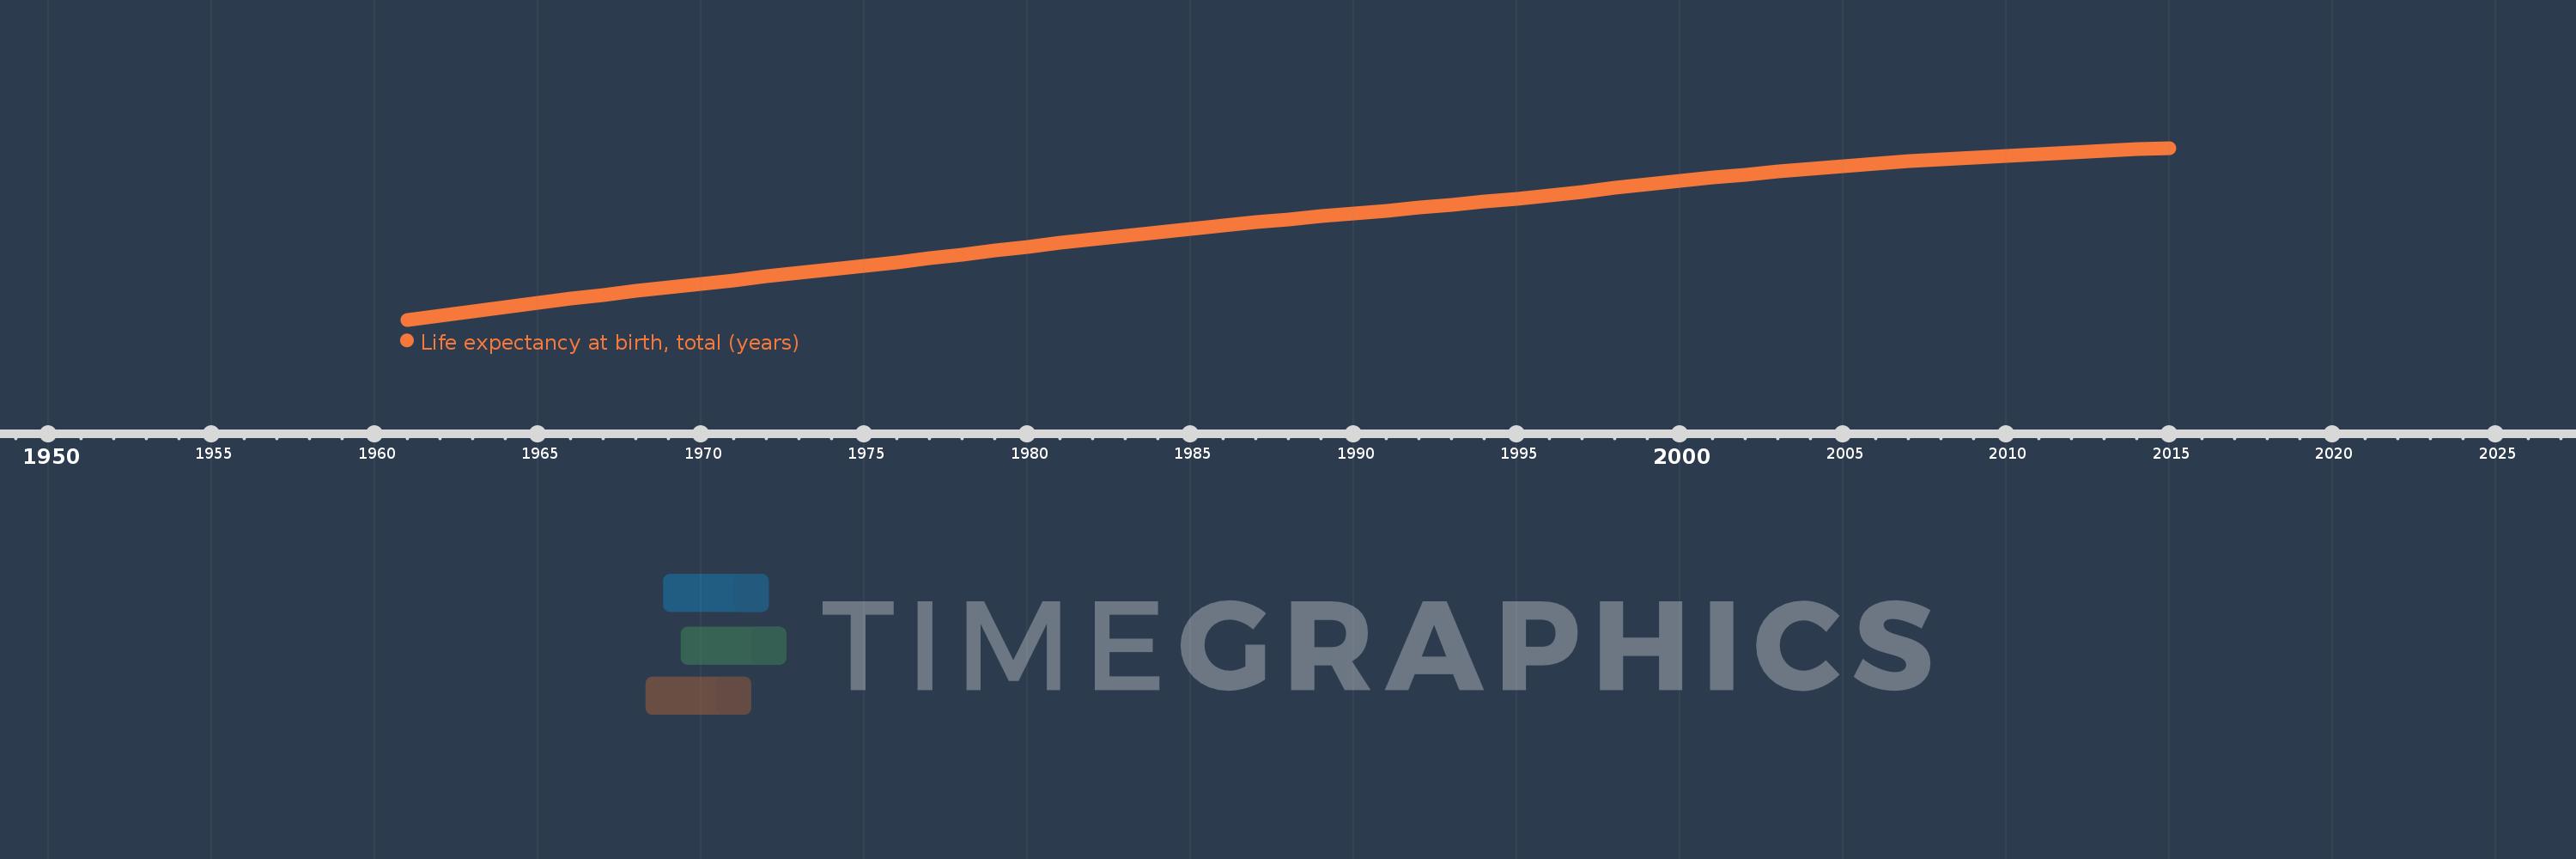
Life expectancy at birth, total (years)
2015,2014,2013,2012,2011,2010,2009,2008,2007,2006,2005,2004,2003,2002,2001,2000,1999,1998,1997,1996,1995,1994,1993,1992,1991,1990,1989,1988,1987,1986,1985,1984,1983,1982,1981,1980,1979,1978,1977,1976,1975,1974,1973,1972,1971,1970,1969,1968,1967,1966,1965,1964,1963,1962,1961
This statistics in other country:
AfghanistanAlbaniaAlgeriaAngolaAntigua and BarbudaArab WorldArgentinaArmeniaArubaAustraliaAustriaAzerbaijanBahamas, TheBahrainBangladeshBarbadosBelarusBelgiumBelizeBeninBermudaBhutanBoliviaBosnia and HerzegovinaBotswanaBrazilBrunei DarussalamBulgariaBurkina FasoBurundiCabo VerdeCambodiaCameroonCanadaCaribbean small statesCentral African RepublicCentral Europe and the BalticsChadChannel IslandsChileChinaColombiaComorosCongo, Dem. Rep.Congo, Rep.Costa RicaCote d'IvoireCroatiaCubaCuracaoCyprusCzech RepublicDenmarkDjiboutiDominicaDominican RepublicEarly-demographic dividendEast Asia & PacificEast Asia & Pacific (excluding high income)East Asia & Pacific (IDA & IBRD countries)EcuadorEgypt, Arab Rep.El SalvadorEquatorial GuineaEritreaEstoniaEthiopiaEuro areaEurope & Central AsiaEurope & Central Asia (excluding high income)Europe & Central Asia (IDA & IBRD countries)European UnionFaroe IslandsFijiFinlandFragile and conflict affected situationsFranceFrench PolynesiaGabonGambia, TheGeorgiaGermanyGhanaGreeceGreenlandGrenadaGuamGuatemalaGuineaGuinea-BissauGuyanaHaitiHeavily indebted poor countries (HIPC)High incomeHondurasHong Kong SAR, ChinaHungaryIBRD onlyIcelandIDA & IBRD totalIDA blendIDA onlyIDA totalIndiaIndonesiaIran, Islamic Rep.IraqIrelandIsle of ManIsraelItalyJamaicaJapanJordanKazakhstanKenyaKiribatiKorea, Dem. People’s Rep.Korea, Rep.KosovoKuwaitKyrgyz RepublicLao PDRLate-demographic dividendLatin America & Caribbean Latin America & Caribbean (excluding high income)Latin America & the Caribbean (IDA & IBRD countries)LatviaLeast developed countries: UN classificationLebanonLesothoLiberiaLibyaLiechtensteinLithuaniaLow & middle incomeLow incomeLower middle incomeLuxembourgMacao SAR, ChinaMacedonia, FYRMadagascarMalawiMalaysiaMaldivesMaliMaltaMarshall IslandsMauritaniaMauritiusMexicoMicronesia, Fed. Sts.Middle East & North AfricaMiddle East & North Africa (excluding high income)Middle East & North Africa (IDA & IBRD countries)Middle incomeMoldovaMongoliaMontenegroMoroccoMozambiqueMyanmarNamibiaNepalNetherlandsNew CaledoniaNew ZealandNicaraguaNigerNigeriaNorth AmericaNorwayOECD membersOmanOther small statesPacific island small statesPakistanPalauPanamaPapua New GuineaParaguayPeruPhilippinesPolandPortugalPost-demographic dividendPre-demographic dividendPuerto RicoQatarRomaniaRussian FederationRwandaSamoaSan MarinoSao Tome and PrincipeSaudi ArabiaSenegalSerbiaSeychellesSierra LeoneSingaporeSint Maarten (Dutch part)Slovak RepublicSloveniaSmall statesSolomon IslandsSomaliaSouth AfricaSouth AsiaSouth Asia (IDA & IBRD)South SudanSpainSri LankaSt. Kitts and NevisSt. LuciaSt. Martin (French part)St. Vincent and the GrenadinesSub-Saharan Africa Sub-Saharan Africa (excluding high income)Sub-Saharan Africa (IDA & IBRD countries)SudanSurinameSwazilandSwedenSwitzerlandSyrian Arab RepublicTajikistanTanzaniaThailandTimor-LesteTogoTongaTrinidad and TobagoTunisiaTurkeyTurkmenistanUgandaUkraineUnited Arab EmiratesUnited KingdomUnited StatesUpper middle incomeUruguayUzbekistanVanuatuVenezuela, RBVietnamVirgin Islands (U.S.)West Bank and GazaWorldYemen, Rep.ZambiaZimbabwe Timeline:
This timeline shows a graph from 1961 to 2015 of Turkey. No data until 1960. Number of actual observations by date: 55.
Source name:
World Development Indicators
Source organization:
Derived from male and female life expectancy at birth from sources such as: (1) United Nations Population Division. World Population Prospects, (2) Census reports and other statistical publications from national statistical offices, (3) Eurostat: Demographic Statistics, (4) United Nations Statistical Division. Population and Vital Statistics Reprot (various years), (5) U.S. Census Bureau: International Database, and (6) Secretariat of the Pacific Community: Statistics and Demography Programme.
Categories, topics:
Health
Last updated:
apr 23, 2017
Indicators value changes by year
Minimum:
45.384
jan 1, 1961
Maximum:
75.164
jan 1, 2015
At the date of observation
Value
Absolute change
Change from previous value
jan 1, 1961
45.384
+45.384
0.0%
jan 1, 1962
46.104
+0.72
1.59%
jan 1, 1963
46.837
+0.732
1.59%
jan 1, 1964
47.574
+0.737
1.57%
jan 1, 1965
48.306
+0.732
1.54%
jan 1, 1966
49.023
+0.717
1.48%
jan 1, 1967
49.716
+0.692
1.41%
jan 1, 1968
50.384
+0.668
1.34%
jan 1, 1969
51.029
+0.645
1.28%
jan 1, 1970
51.652
+0.623
1.22%
jan 1, 1971
52.261
+0.609
1.18%
jan 1, 1972
52.865
+0.604
1.16%
jan 1, 1973
53.475
+0.61
1.15%
jan 1, 1974
54.097
+0.621
1.16%
jan 1, 1975
54.734
+0.637
1.18%
jan 1, 1976
55.385
+0.652
1.19%
jan 1, 1977
56.05
+0.665
1.2%
jan 1, 1978
56.719
+0.669
1.19%
jan 1, 1979
57.385
+0.666
1.17%
jan 1, 1980
58.044
+0.659
1.15%
jan 1, 1981
58.692
+0.647
1.12%
jan 1, 1982
59.326
+0.635
1.08%
jan 1, 1983
59.946
+0.62
1.05%
jan 1, 1984
60.553
+0.606
1.01%
jan 1, 1985
61.143
+0.591
0.98%
jan 1, 1986
61.714
+0.571
0.93%
jan 1, 1987
62.262
+0.548
0.89%
jan 1, 1988
62.788
+0.525
0.84%
jan 1, 1989
63.295
+0.507
0.81%
jan 1, 1990
63.79
+0.496
0.78%
jan 1, 1991
64.282
+0.492
0.77%
jan 1, 1992
64.783
+0.501
0.78%
jan 1, 1993
65.3
+0.517
0.8%
jan 1, 1994
65.838
+0.538
0.82%
jan 1, 1995
66.399
+0.561
0.85%
jan 1, 1996
66.982
+0.583
0.88%
jan 1, 1997
67.586
+0.604
0.9%
jan 1, 1998
68.2
+0.613
0.91%
jan 1, 1999
68.812
+0.613
0.9%
jan 1, 2000
69.415
+0.603
0.88%
jan 1, 2001
69.999
+0.584
0.84%
jan 1, 2002
70.556
+0.556
0.79%
jan 1, 2003
71.082
+0.526
0.75%
jan 1, 2004
71.574
+0.492
0.69%
jan 1, 2005
72.03
+0.456
0.64%
jan 1, 2006
72.448
+0.418
0.58%
jan 1, 2007
72.829
+0.38
0.53%
jan 1, 2008
73.177
+0.348
0.48%
jan 1, 2009
73.501
+0.324
0.44%
jan 1, 2010
73.803
+0.302
0.41%
jan 1, 2011
74.091
+0.288
0.39%
jan 1, 2012
74.367
+0.276
0.37%
jan 1, 2013
74.637
+0.269
0.36%
jan 1, 2014
74.901
+0.264
0.35%
jan 1, 2015
75.164
+0.263
0.35%
Ranking of countries by current statistics by years


Comments: