29
/
en
AIzaSyAYiBZKx7MnpbEhh9jyipgxe19OcubqV5w
April 1, 2024
182286
Luxembourg
LUX
true
2
1
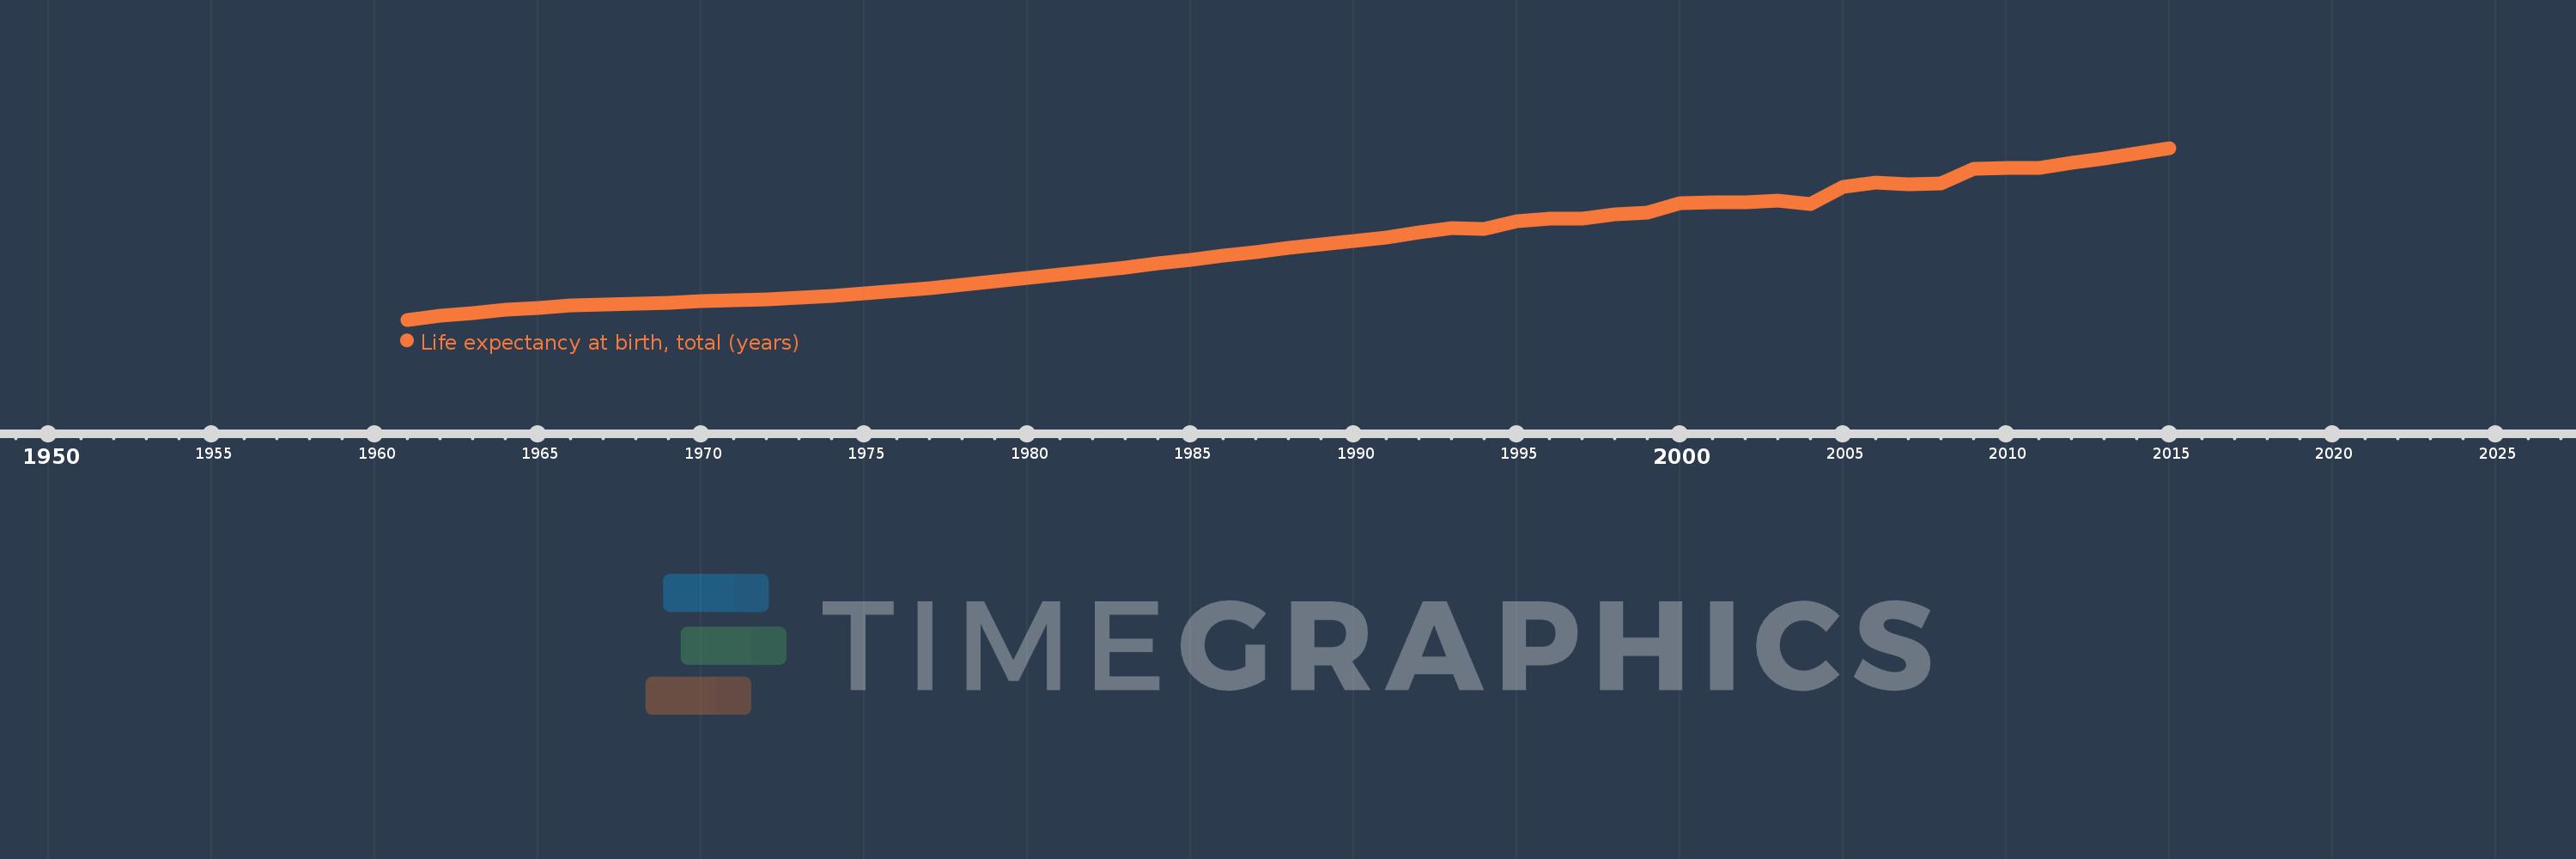
Life expectancy at birth, total (years)
2015,2014,2013,2012,2011,2010,2009,2008,2007,2006,2005,2004,2003,2002,2001,2000,1999,1998,1997,1996,1995,1994,1993,1992,1991,1990,1989,1988,1987,1986,1985,1984,1983,1982,1981,1980,1979,1978,1977,1976,1975,1974,1973,1972,1971,1970,1969,1968,1967,1966,1965,1964,1963,1962,1961
This statistics in other country:
AfghanistanAlbaniaAlgeriaAngolaAntigua and BarbudaArab WorldArgentinaArmeniaArubaAustraliaAustriaAzerbaijanBahamas, TheBahrainBangladeshBarbadosBelarusBelgiumBelizeBeninBermudaBhutanBoliviaBosnia and HerzegovinaBotswanaBrazilBrunei DarussalamBulgariaBurkina FasoBurundiCabo VerdeCambodiaCameroonCanadaCaribbean small statesCentral African RepublicCentral Europe and the BalticsChadChannel IslandsChileChinaColombiaComorosCongo, Dem. Rep.Congo, Rep.Costa RicaCote d'IvoireCroatiaCubaCuracaoCyprusCzech RepublicDenmarkDjiboutiDominicaDominican RepublicEarly-demographic dividendEast Asia & PacificEast Asia & Pacific (excluding high income)East Asia & Pacific (IDA & IBRD countries)EcuadorEgypt, Arab Rep.El SalvadorEquatorial GuineaEritreaEstoniaEthiopiaEuro areaEurope & Central AsiaEurope & Central Asia (excluding high income)Europe & Central Asia (IDA & IBRD countries)European UnionFaroe IslandsFijiFinlandFragile and conflict affected situationsFranceFrench PolynesiaGabonGambia, TheGeorgiaGermanyGhanaGreeceGreenlandGrenadaGuamGuatemalaGuineaGuinea-BissauGuyanaHaitiHeavily indebted poor countries (HIPC)High incomeHondurasHong Kong SAR, ChinaHungaryIBRD onlyIcelandIDA & IBRD totalIDA blendIDA onlyIDA totalIndiaIndonesiaIran, Islamic Rep.IraqIrelandIsle of ManIsraelItalyJamaicaJapanJordanKazakhstanKenyaKiribatiKorea, Dem. People’s Rep.Korea, Rep.KosovoKuwaitKyrgyz RepublicLao PDRLate-demographic dividendLatin America & Caribbean Latin America & Caribbean (excluding high income)Latin America & the Caribbean (IDA & IBRD countries)LatviaLeast developed countries: UN classificationLebanonLesothoLiberiaLibyaLiechtensteinLithuaniaLow & middle incomeLow incomeLower middle incomeLuxembourgMacao SAR, ChinaMacedonia, FYRMadagascarMalawiMalaysiaMaldivesMaliMaltaMarshall IslandsMauritaniaMauritiusMexicoMicronesia, Fed. Sts.Middle East & North AfricaMiddle East & North Africa (excluding high income)Middle East & North Africa (IDA & IBRD countries)Middle incomeMoldovaMongoliaMontenegroMoroccoMozambiqueMyanmarNamibiaNepalNetherlandsNew CaledoniaNew ZealandNicaraguaNigerNigeriaNorth AmericaNorwayOECD membersOmanOther small statesPacific island small statesPakistanPalauPanamaPapua New GuineaParaguayPeruPhilippinesPolandPortugalPost-demographic dividendPre-demographic dividendPuerto RicoQatarRomaniaRussian FederationRwandaSamoaSan MarinoSao Tome and PrincipeSaudi ArabiaSenegalSerbiaSeychellesSierra LeoneSingaporeSint Maarten (Dutch part)Slovak RepublicSloveniaSmall statesSolomon IslandsSomaliaSouth AfricaSouth AsiaSouth Asia (IDA & IBRD)South SudanSpainSri LankaSt. Kitts and NevisSt. LuciaSt. Martin (French part)St. Vincent and the GrenadinesSub-Saharan Africa Sub-Saharan Africa (excluding high income)Sub-Saharan Africa (IDA & IBRD countries)SudanSurinameSwazilandSwedenSwitzerlandSyrian Arab RepublicTajikistanTanzaniaThailandTimor-LesteTogoTongaTrinidad and TobagoTunisiaTurkeyTurkmenistanUgandaUkraineUnited Arab EmiratesUnited KingdomUnited StatesUpper middle incomeUruguayUzbekistanVanuatuVenezuela, RBVietnamVirgin Islands (U.S.)West Bank and GazaWorldYemen, Rep.ZambiaZimbabwe Timeline:
This timeline shows a graph from 1961 to 2015 of Luxembourg. No data until 1960. Number of actual observations by date: 55.
Source name:
World Development Indicators
Source organization:
Derived from male and female life expectancy at birth from sources such as: (1) United Nations Population Division. World Population Prospects, (2) Census reports and other statistical publications from national statistical offices, (3) Eurostat: Demographic Statistics, (4) United Nations Statistical Division. Population and Vital Statistics Reprot (various years), (5) U.S. Census Bureau: International Database, and (6) Secretariat of the Pacific Community: Statistics and Demography Programme.
Categories, topics:
Health
Last updated:
apr 23, 2017
Indicators value changes by year
Minimum:
68.446
jan 1, 1961
Maximum:
82.207
jan 1, 2015
At the date of observation
Value
Absolute change
Change from previous value
jan 1, 1961
68.446
+68.446
0.0%
jan 1, 1962
68.738
+0.291
0.43%
jan 1, 1963
68.998
+0.26
0.38%
jan 1, 1964
69.223
+0.225
0.33%
jan 1, 1965
69.411
+0.188
0.27%
jan 1, 1966
69.561
+0.15
0.22%
jan 1, 1967
69.674
+0.113
0.16%
jan 1, 1968
69.761
+0.087
0.12%
jan 1, 1969
69.835
+0.074
0.11%
jan 1, 1970
69.905
+0.07
0.1%
jan 1, 1971
69.983
+0.079
0.11%
jan 1, 1972
70.081
+0.098
0.14%
jan 1, 1973
70.205
+0.124
0.18%
jan 1, 1974
70.358
+0.153
0.22%
jan 1, 1975
70.543
+0.184
0.26%
jan 1, 1976
70.758
+0.215
0.3%
jan 1, 1977
70.999
+0.241
0.34%
jan 1, 1978
71.256
+0.258
0.36%
jan 1, 1979
71.522
+0.266
0.37%
jan 1, 1980
71.794
+0.272
0.38%
jan 1, 1981
72.073
+0.278
0.39%
jan 1, 1982
72.358
+0.285
0.4%
jan 1, 1983
72.653
+0.296
0.41%
jan 1, 1984
72.959
+0.305
0.42%
jan 1, 1985
73.272
+0.313
0.43%
jan 1, 1986
73.586
+0.314
0.43%
jan 1, 1987
73.895
+0.309
0.42%
jan 1, 1988
74.194
+0.299
0.4%
jan 1, 1989
74.48
+0.287
0.39%
jan 1, 1990
74.752
+0.272
0.37%
jan 1, 1991
75.01
+0.258
0.35%
jan 1, 1992
75.463
+0.453
0.6%
jan 1, 1993
75.771
+0.307
0.41%
jan 1, 1994
75.712
-0.059
-0.08%
jan 1, 1995
76.371
+0.659
0.87%
jan 1, 1996
76.512
+0.141
0.19%
jan 1, 1997
76.52
+0.007
0.01%
jan 1, 1998
76.88
+0.361
0.47%
jan 1, 1999
77.017
+0.137
0.18%
jan 1, 2000
77.771
+0.754
0.98%
jan 1, 2001
77.873
+0.102
0.13%
jan 1, 2002
77.824
-0.049
-0.06%
jan 1, 2003
77.966
+0.141
0.18%
jan 1, 2004
77.727
-0.239
-0.31%
jan 1, 2005
79.122
+1.395
1.79%
jan 1, 2006
79.432
+0.31
0.39%
jan 1, 2007
79.288
-0.144
-0.18%
jan 1, 2008
79.383
+0.095
0.12%
jan 1, 2009
80.539
+1.156
1.46%
jan 1, 2010
80.637
+0.098
0.12%
jan 1, 2011
80.632
-0.005
-0.01%
jan 1, 2012
80.988
+0.356
0.44%
jan 1, 2013
81.393
+0.405
0.5%
jan 1, 2014
81.8
+0.407
0.5%
jan 1, 2015
82.207
+0.407
0.5%
Ranking of countries by current statistics by years


Comments: