29
/
en
AIzaSyAYiBZKx7MnpbEhh9jyipgxe19OcubqV5w
April 1, 2024
173083
Kyrgyz Republic
KGZ
true
2
1
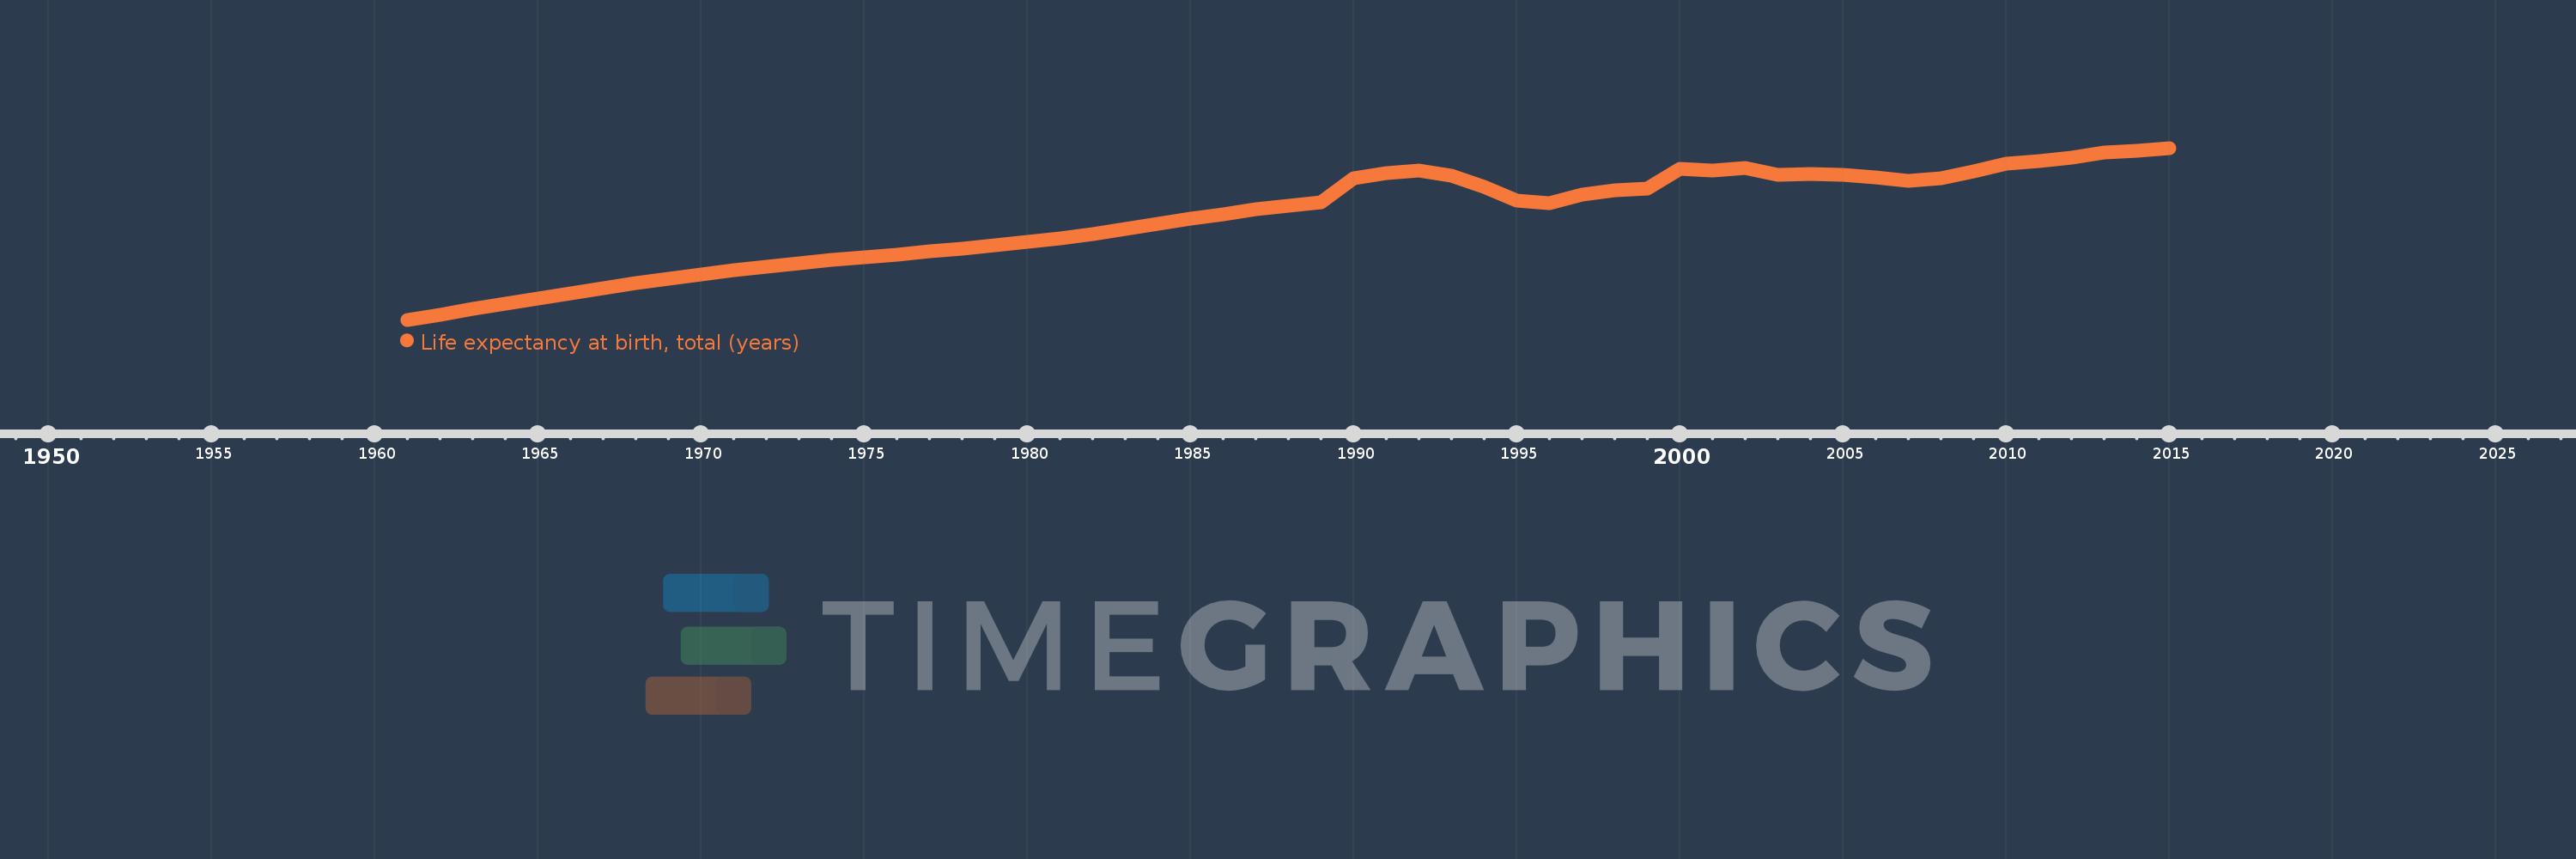
Life expectancy at birth, total (years)
2015,2014,2013,2012,2011,2010,2009,2008,2007,2006,2005,2004,2003,2002,2001,2000,1999,1998,1997,1996,1995,1994,1993,1992,1991,1990,1989,1988,1987,1986,1985,1984,1983,1982,1981,1980,1979,1978,1977,1976,1975,1974,1973,1972,1971,1970,1969,1968,1967,1966,1965,1964,1963,1962,1961
This statistics in other country:
AfghanistanAlbaniaAlgeriaAngolaAntigua and BarbudaArab WorldArgentinaArmeniaArubaAustraliaAustriaAzerbaijanBahamas, TheBahrainBangladeshBarbadosBelarusBelgiumBelizeBeninBermudaBhutanBoliviaBosnia and HerzegovinaBotswanaBrazilBrunei DarussalamBulgariaBurkina FasoBurundiCabo VerdeCambodiaCameroonCanadaCaribbean small statesCentral African RepublicCentral Europe and the BalticsChadChannel IslandsChileChinaColombiaComorosCongo, Dem. Rep.Congo, Rep.Costa RicaCote d'IvoireCroatiaCubaCuracaoCyprusCzech RepublicDenmarkDjiboutiDominicaDominican RepublicEarly-demographic dividendEast Asia & PacificEast Asia & Pacific (excluding high income)East Asia & Pacific (IDA & IBRD countries)EcuadorEgypt, Arab Rep.El SalvadorEquatorial GuineaEritreaEstoniaEthiopiaEuro areaEurope & Central AsiaEurope & Central Asia (excluding high income)Europe & Central Asia (IDA & IBRD countries)European UnionFaroe IslandsFijiFinlandFragile and conflict affected situationsFranceFrench PolynesiaGabonGambia, TheGeorgiaGermanyGhanaGreeceGreenlandGrenadaGuamGuatemalaGuineaGuinea-BissauGuyanaHaitiHeavily indebted poor countries (HIPC)High incomeHondurasHong Kong SAR, ChinaHungaryIBRD onlyIcelandIDA & IBRD totalIDA blendIDA onlyIDA totalIndiaIndonesiaIran, Islamic Rep.IraqIrelandIsle of ManIsraelItalyJamaicaJapanJordanKazakhstanKenyaKiribatiKorea, Dem. People’s Rep.Korea, Rep.KosovoKuwaitKyrgyz RepublicLao PDRLate-demographic dividendLatin America & Caribbean Latin America & Caribbean (excluding high income)Latin America & the Caribbean (IDA & IBRD countries)LatviaLeast developed countries: UN classificationLebanonLesothoLiberiaLibyaLiechtensteinLithuaniaLow & middle incomeLow incomeLower middle incomeLuxembourgMacao SAR, ChinaMacedonia, FYRMadagascarMalawiMalaysiaMaldivesMaliMaltaMarshall IslandsMauritaniaMauritiusMexicoMicronesia, Fed. Sts.Middle East & North AfricaMiddle East & North Africa (excluding high income)Middle East & North Africa (IDA & IBRD countries)Middle incomeMoldovaMongoliaMontenegroMoroccoMozambiqueMyanmarNamibiaNepalNetherlandsNew CaledoniaNew ZealandNicaraguaNigerNigeriaNorth AmericaNorwayOECD membersOmanOther small statesPacific island small statesPakistanPalauPanamaPapua New GuineaParaguayPeruPhilippinesPolandPortugalPost-demographic dividendPre-demographic dividendPuerto RicoQatarRomaniaRussian FederationRwandaSamoaSan MarinoSao Tome and PrincipeSaudi ArabiaSenegalSerbiaSeychellesSierra LeoneSingaporeSint Maarten (Dutch part)Slovak RepublicSloveniaSmall statesSolomon IslandsSomaliaSouth AfricaSouth AsiaSouth Asia (IDA & IBRD)South SudanSpainSri LankaSt. Kitts and NevisSt. LuciaSt. Martin (French part)St. Vincent and the GrenadinesSub-Saharan Africa Sub-Saharan Africa (excluding high income)Sub-Saharan Africa (IDA & IBRD countries)SudanSurinameSwazilandSwedenSwitzerlandSyrian Arab RepublicTajikistanTanzaniaThailandTimor-LesteTogoTongaTrinidad and TobagoTunisiaTurkeyTurkmenistanUgandaUkraineUnited Arab EmiratesUnited KingdomUnited StatesUpper middle incomeUruguayUzbekistanVanuatuVenezuela, RBVietnamVirgin Islands (U.S.)West Bank and GazaWorldYemen, Rep.ZambiaZimbabwe Timeline:
This timeline shows a graph from 1961 to 2015 of Kyrgyz Republic. No data until 1960. Number of actual observations by date: 55.
Source name:
World Development Indicators
Source organization:
Derived from male and female life expectancy at birth from sources such as: (1) United Nations Population Division. World Population Prospects, (2) Census reports and other statistical publications from national statistical offices, (3) Eurostat: Demographic Statistics, (4) United Nations Statistical Division. Population and Vital Statistics Reprot (various years), (5) U.S. Census Bureau: International Database, and (6) Secretariat of the Pacific Community: Statistics and Demography Programme.
Categories, topics:
Health
Last updated:
apr 23, 2017
Indicators value changes by year
Minimum:
56.128
jan 1, 1961
Maximum:
70.402
jan 1, 2015
At the date of observation
Value
Absolute change
Change from previous value
jan 1, 1961
56.128
+56.128
0.0%
jan 1, 1962
56.564
+0.436
0.78%
jan 1, 1963
57.003
+0.439
0.78%
jan 1, 1964
57.443
+0.441
0.77%
jan 1, 1965
57.882
+0.439
0.76%
jan 1, 1966
58.315
+0.433
0.75%
jan 1, 1967
58.738
+0.423
0.73%
jan 1, 1968
59.146
+0.408
0.69%
jan 1, 1969
59.536
+0.39
0.66%
jan 1, 1970
59.904
+0.368
0.62%
jan 1, 1971
60.245
+0.341
0.57%
jan 1, 1972
60.554
+0.31
0.51%
jan 1, 1973
60.835
+0.281
0.46%
jan 1, 1974
61.093
+0.257
0.42%
jan 1, 1975
61.333
+0.24
0.39%
jan 1, 1976
61.565
+0.232
0.38%
jan 1, 1977
61.797
+0.232
0.38%
jan 1, 1978
62.04
+0.243
0.39%
jan 1, 1979
62.301
+0.261
0.42%
jan 1, 1980
62.586
+0.285
0.46%
jan 1, 1981
62.904
+0.318
0.51%
jan 1, 1982
63.264
+0.36
0.57%
jan 1, 1983
63.659
+0.395
0.62%
jan 1, 1984
64.078
+0.419
0.66%
jan 1, 1985
64.505
+0.427
0.67%
jan 1, 1986
64.919
+0.414
0.64%
jan 1, 1987
65.294
+0.375
0.58%
jan 1, 1988
65.611
+0.317
0.49%
jan 1, 1989
65.859
+0.247
0.38%
jan 1, 1990
67.907
+2.049
3.11%
jan 1, 1991
68.298
+0.39
0.57%
jan 1, 1992
68.551
+0.254
0.37%
jan 1, 1993
68.102
-0.449
-0.65%
jan 1, 1994
67.193
-0.91
-1.34%
jan 1, 1995
66.039
-1.154
-1.72%
jan 1, 1996
65.79
-0.249
-0.38%
jan 1, 1997
66.544
+0.754
1.15%
jan 1, 1998
66.893
+0.349
0.52%
jan 1, 1999
67.051
+0.159
0.24%
jan 1, 2000
68.656
+1.605
2.39%
jan 1, 2001
68.559
-0.098
-0.14%
jan 1, 2002
68.707
+0.149
0.22%
jan 1, 2003
68.156
-0.551
-0.8%
jan 1, 2004
68.256
+0.1
0.15%
jan 1, 2005
68.154
-0.102
-0.15%
jan 1, 2006
67.956
-0.198
-0.29%
jan 1, 2007
67.695
-0.261
-0.38%
jan 1, 2008
67.895
+0.2
0.3%
jan 1, 2009
68.451
+0.556
0.82%
jan 1, 2010
69.102
+0.651
0.95%
jan 1, 2011
69.3
+0.198
0.29%
jan 1, 2012
69.602
+0.302
0.44%
jan 1, 2013
70.002
+0.4
0.57%
jan 1, 2014
70.202
+0.2
0.29%
jan 1, 2015
70.402
+0.2
0.28%
Ranking of countries by current statistics by years


Comments: