29
/
en
AIzaSyAYiBZKx7MnpbEhh9jyipgxe19OcubqV5w
April 1, 2024
55667
Pre-demographic dividend
PRE
false
2
1
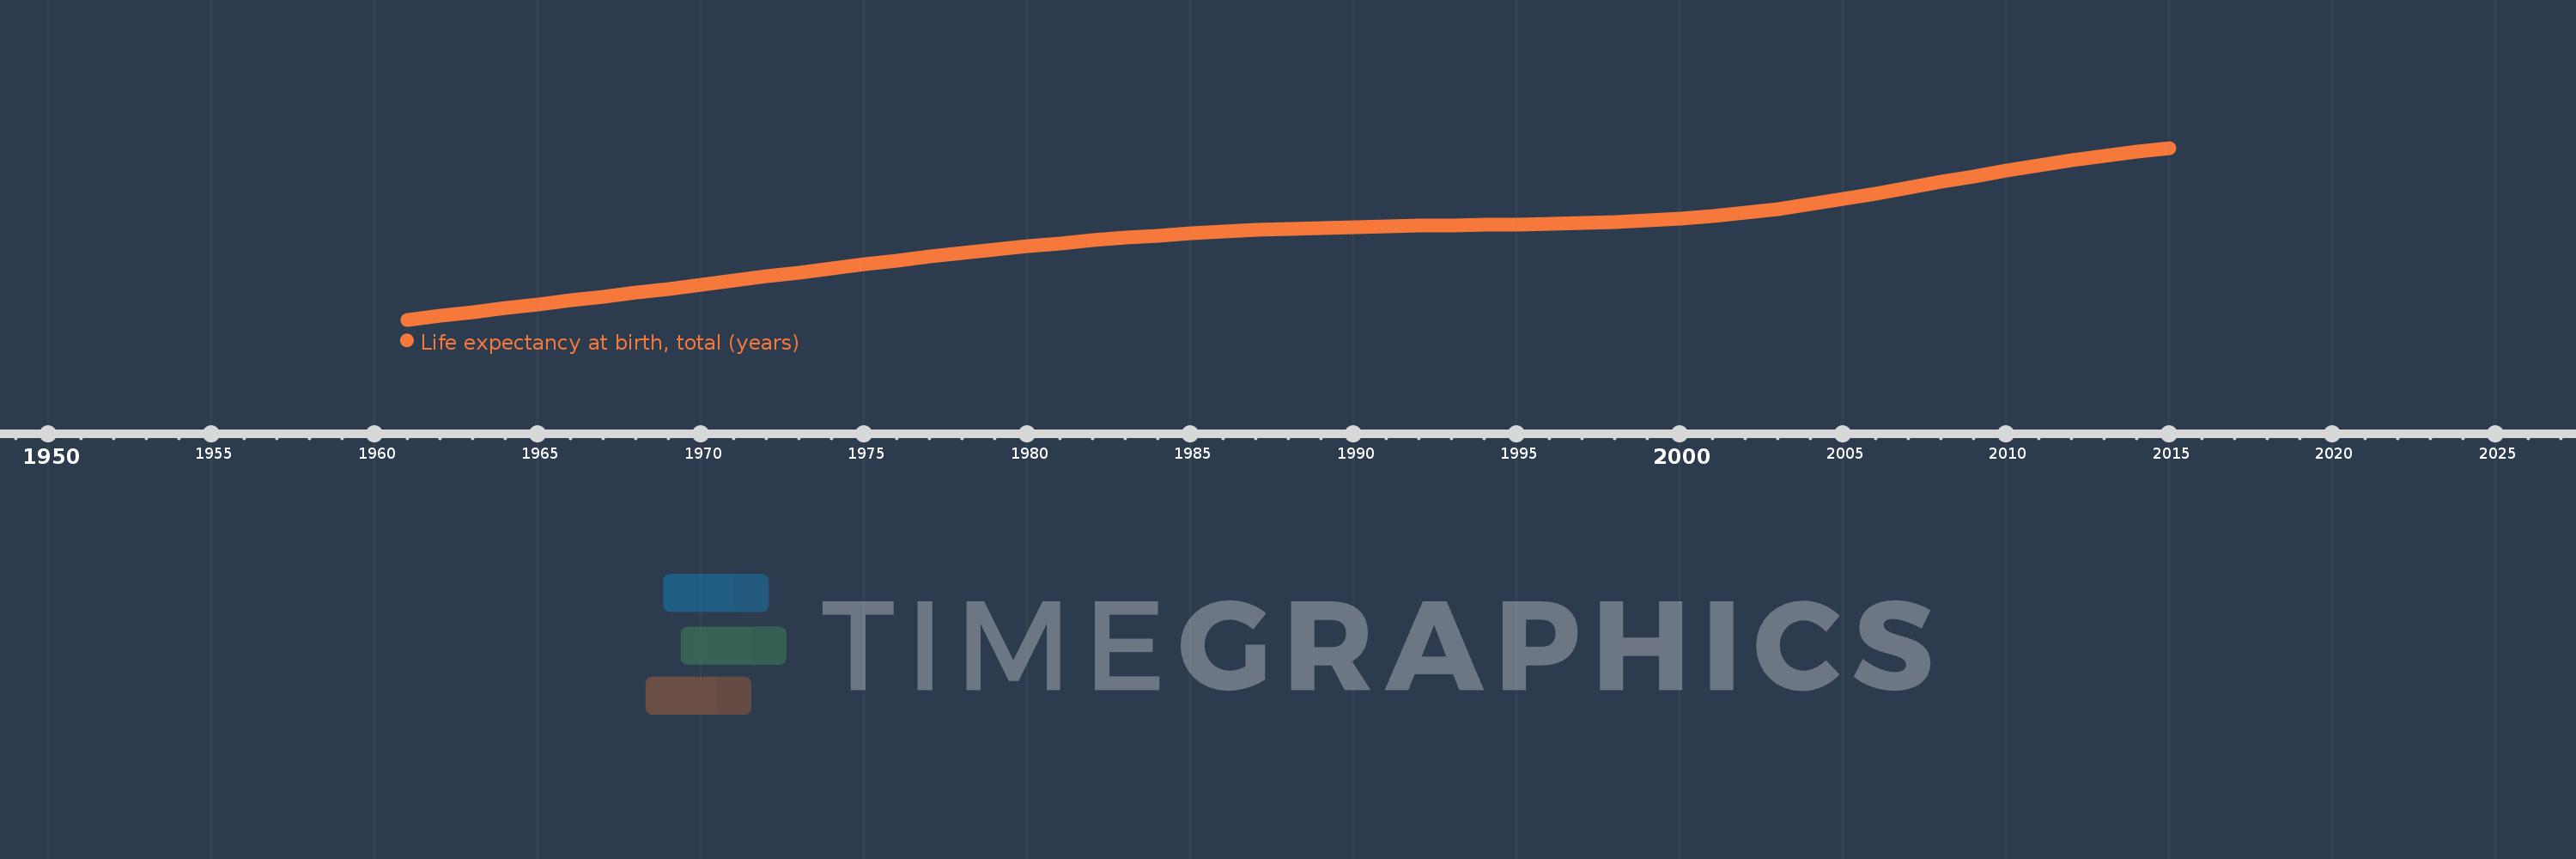
Life expectancy at birth, total (years)
2015,2014,2013,2012,2011,2010,2009,2008,2007,2006,2005,2004,2003,2002,2001,2000,1999,1998,1997,1996,1995,1994,1993,1992,1991,1990,1989,1988,1987,1986,1985,1984,1983,1982,1981,1980,1979,1978,1977,1976,1975,1974,1973,1972,1971,1970,1969,1968,1967,1966,1965,1964,1963,1962,1961
This statistics in other country:
AfghanistanAlbaniaAlgeriaAngolaAntigua and BarbudaArab WorldArgentinaArmeniaArubaAustraliaAustriaAzerbaijanBahamas, TheBahrainBangladeshBarbadosBelarusBelgiumBelizeBeninBermudaBhutanBoliviaBosnia and HerzegovinaBotswanaBrazilBrunei DarussalamBulgariaBurkina FasoBurundiCabo VerdeCambodiaCameroonCanadaCaribbean small statesCentral African RepublicCentral Europe and the BalticsChadChannel IslandsChileChinaColombiaComorosCongo, Dem. Rep.Congo, Rep.Costa RicaCote d'IvoireCroatiaCubaCuracaoCyprusCzech RepublicDenmarkDjiboutiDominicaDominican RepublicEarly-demographic dividendEast Asia & PacificEast Asia & Pacific (excluding high income)East Asia & Pacific (IDA & IBRD countries)EcuadorEgypt, Arab Rep.El SalvadorEquatorial GuineaEritreaEstoniaEthiopiaEuro areaEurope & Central AsiaEurope & Central Asia (excluding high income)Europe & Central Asia (IDA & IBRD countries)European UnionFaroe IslandsFijiFinlandFragile and conflict affected situationsFranceFrench PolynesiaGabonGambia, TheGeorgiaGermanyGhanaGreeceGreenlandGrenadaGuamGuatemalaGuineaGuinea-BissauGuyanaHaitiHeavily indebted poor countries (HIPC)High incomeHondurasHong Kong SAR, ChinaHungaryIBRD onlyIcelandIDA & IBRD totalIDA blendIDA onlyIDA totalIndiaIndonesiaIran, Islamic Rep.IraqIrelandIsle of ManIsraelItalyJamaicaJapanJordanKazakhstanKenyaKiribatiKorea, Dem. People’s Rep.Korea, Rep.KosovoKuwaitKyrgyz RepublicLao PDRLate-demographic dividendLatin America & Caribbean Latin America & Caribbean (excluding high income)Latin America & the Caribbean (IDA & IBRD countries)LatviaLeast developed countries: UN classificationLebanonLesothoLiberiaLibyaLiechtensteinLithuaniaLow & middle incomeLow incomeLower middle incomeLuxembourgMacao SAR, ChinaMacedonia, FYRMadagascarMalawiMalaysiaMaldivesMaliMaltaMarshall IslandsMauritaniaMauritiusMexicoMicronesia, Fed. Sts.Middle East & North AfricaMiddle East & North Africa (excluding high income)Middle East & North Africa (IDA & IBRD countries)Middle incomeMoldovaMongoliaMontenegroMoroccoMozambiqueMyanmarNamibiaNepalNetherlandsNew CaledoniaNew ZealandNicaraguaNigerNigeriaNorth AmericaNorwayOECD membersOmanOther small statesPacific island small statesPakistanPalauPanamaPapua New GuineaParaguayPeruPhilippinesPolandPortugalPost-demographic dividendPre-demographic dividendPuerto RicoQatarRomaniaRussian FederationRwandaSamoaSan MarinoSao Tome and PrincipeSaudi ArabiaSenegalSerbiaSeychellesSierra LeoneSingaporeSint Maarten (Dutch part)Slovak RepublicSloveniaSmall statesSolomon IslandsSomaliaSouth AfricaSouth AsiaSouth Asia (IDA & IBRD)South SudanSpainSri LankaSt. Kitts and NevisSt. LuciaSt. Martin (French part)St. Vincent and the GrenadinesSub-Saharan Africa Sub-Saharan Africa (excluding high income)Sub-Saharan Africa (IDA & IBRD countries)SudanSurinameSwazilandSwedenSwitzerlandSyrian Arab RepublicTajikistanTanzaniaThailandTimor-LesteTogoTongaTrinidad and TobagoTunisiaTurkeyTurkmenistanUgandaUkraineUnited Arab EmiratesUnited KingdomUnited StatesUpper middle incomeUruguayUzbekistanVanuatuVenezuela, RBVietnamVirgin Islands (U.S.)West Bank and GazaWorldYemen, Rep.ZambiaZimbabwe Timeline:
This timeline shows a graph from 1961 to 2015 of Pre-demographic dividend. No data until 1960. Number of actual observations by date: 55.
Source name:
World Development Indicators
Source organization:
Derived from male and female life expectancy at birth from sources such as: (1) United Nations Population Division. World Population Prospects, (2) Census reports and other statistical publications from national statistical offices, (3) Eurostat: Demographic Statistics, (4) United Nations Statistical Division. Population and Vital Statistics Reprot (various years), (5) U.S. Census Bureau: International Database, and (6) Secretariat of the Pacific Community: Statistics and Demography Programme.
Categories, topics:
Health
Last updated:
apr 23, 2017
Indicators value changes by year
Minimum:
38.849
jan 1, 1961
Maximum:
58.365
jan 1, 2015
At the date of observation
Value
Absolute change
Change from previous value
jan 1, 1961
38.849
+38.849
0.0%
jan 1, 1962
39.297
+0.448
1.15%
jan 1, 1963
39.74
+0.443
1.13%
jan 1, 1964
40.178
+0.438
1.1%
jan 1, 1965
40.612
+0.434
1.08%
jan 1, 1966
41.045
+0.433
1.07%
jan 1, 1967
41.481
+0.436
1.06%
jan 1, 1968
41.923
+0.442
1.06%
jan 1, 1969
42.371
+0.449
1.07%
jan 1, 1970
42.827
+0.455
1.07%
jan 1, 1971
43.288
+0.461
1.08%
jan 1, 1972
43.755
+0.467
1.08%
jan 1, 1973
44.224
+0.469
1.07%
jan 1, 1974
44.691
+0.467
1.06%
jan 1, 1975
45.15
+0.459
1.03%
jan 1, 1976
45.598
+0.448
0.99%
jan 1, 1977
46.029
+0.431
0.95%
jan 1, 1978
46.441
+0.412
0.89%
jan 1, 1979
46.831
+0.39
0.84%
jan 1, 1980
47.198
+0.367
0.78%
jan 1, 1981
47.54
+0.342
0.72%
jan 1, 1982
47.857
+0.316
0.67%
jan 1, 1983
48.149
+0.292
0.61%
jan 1, 1984
48.416
+0.267
0.55%
jan 1, 1985
48.656
+0.24
0.5%
jan 1, 1986
48.866
+0.21
0.43%
jan 1, 1987
49.042
+0.177
0.36%
jan 1, 1988
49.185
+0.143
0.29%
jan 1, 1989
49.299
+0.113
0.23%
jan 1, 1990
49.39
+0.091
0.18%
jan 1, 1991
49.462
+0.073
0.15%
jan 1, 1992
49.52
+0.058
0.12%
jan 1, 1993
49.569
+0.048
0.1%
jan 1, 1994
49.614
+0.046
0.09%
jan 1, 1995
49.665
+0.051
0.1%
jan 1, 1996
49.729
+0.064
0.13%
jan 1, 1997
49.816
+0.087
0.18%
jan 1, 1998
49.937
+0.121
0.24%
jan 1, 1999
50.103
+0.166
0.33%
jan 1, 2000
50.325
+0.222
0.44%
jan 1, 2001
50.617
+0.293
0.58%
jan 1, 2002
50.992
+0.375
0.74%
jan 1, 2003
51.446
+0.454
0.89%
jan 1, 2004
51.969
+0.523
1.02%
jan 1, 2005
52.549
+0.58
1.12%
jan 1, 2006
53.173
+0.623
1.19%
jan 1, 2007
53.824
+0.651
1.22%
jan 1, 2008
54.485
+0.661
1.23%
jan 1, 2009
55.139
+0.654
1.2%
jan 1, 2010
55.77
+0.631
1.14%
jan 1, 2011
56.366
+0.596
1.07%
jan 1, 2012
56.921
+0.555
0.98%
jan 1, 2013
57.437
+0.516
0.91%
jan 1, 2014
57.918
+0.481
0.84%
jan 1, 2015
58.365
+0.446
0.77%
Ranking of countries by current statistics by years


Comments: