29
/
en
AIzaSyAYiBZKx7MnpbEhh9jyipgxe19OcubqV5w
April 1, 2024
221075
Paraguay
PRY
true
2
1
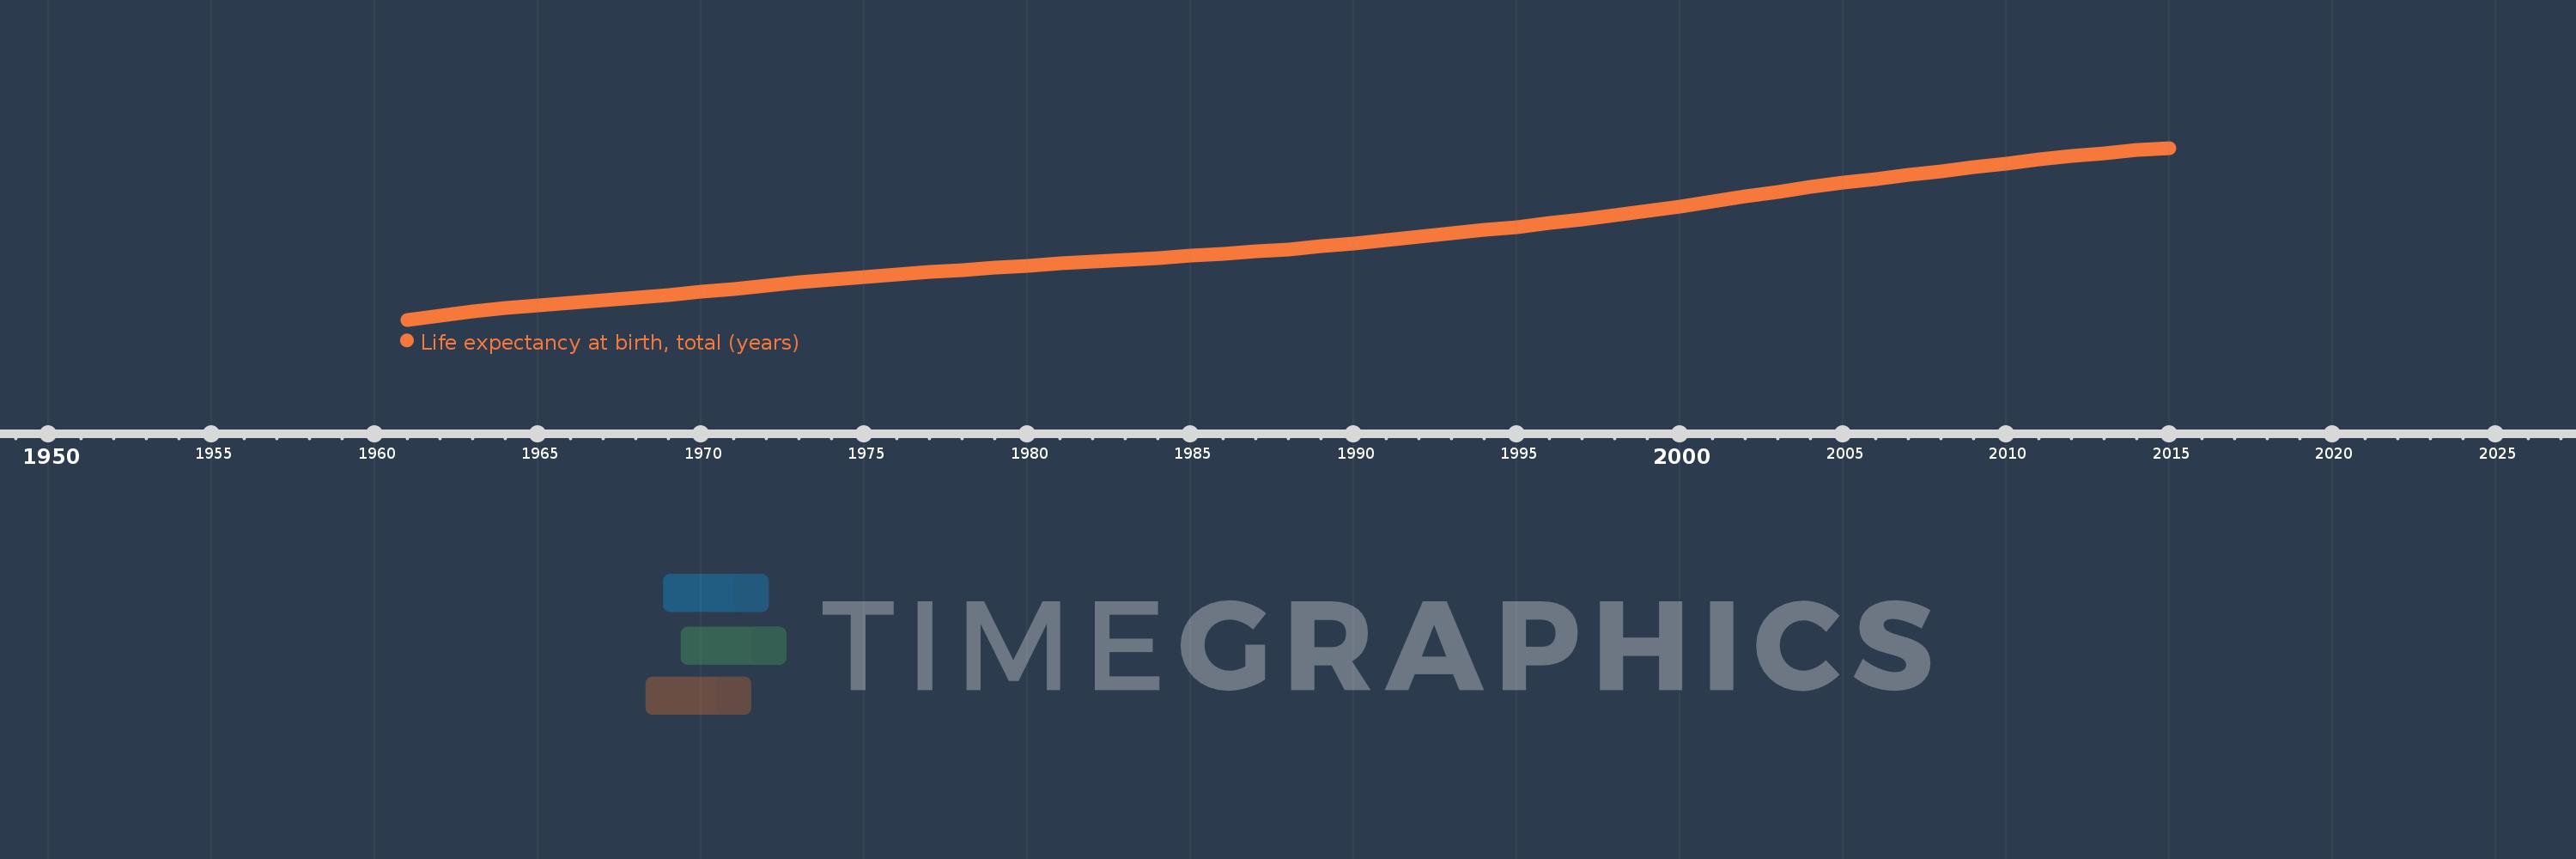
Life expectancy at birth, total (years)
2015,2014,2013,2012,2011,2010,2009,2008,2007,2006,2005,2004,2003,2002,2001,2000,1999,1998,1997,1996,1995,1994,1993,1992,1991,1990,1989,1988,1987,1986,1985,1984,1983,1982,1981,1980,1979,1978,1977,1976,1975,1974,1973,1972,1971,1970,1969,1968,1967,1966,1965,1964,1963,1962,1961
This statistics in other country:
AfghanistanAlbaniaAlgeriaAngolaAntigua and BarbudaArab WorldArgentinaArmeniaArubaAustraliaAustriaAzerbaijanBahamas, TheBahrainBangladeshBarbadosBelarusBelgiumBelizeBeninBermudaBhutanBoliviaBosnia and HerzegovinaBotswanaBrazilBrunei DarussalamBulgariaBurkina FasoBurundiCabo VerdeCambodiaCameroonCanadaCaribbean small statesCentral African RepublicCentral Europe and the BalticsChadChannel IslandsChileChinaColombiaComorosCongo, Dem. Rep.Congo, Rep.Costa RicaCote d'IvoireCroatiaCubaCuracaoCyprusCzech RepublicDenmarkDjiboutiDominicaDominican RepublicEarly-demographic dividendEast Asia & PacificEast Asia & Pacific (excluding high income)East Asia & Pacific (IDA & IBRD countries)EcuadorEgypt, Arab Rep.El SalvadorEquatorial GuineaEritreaEstoniaEthiopiaEuro areaEurope & Central AsiaEurope & Central Asia (excluding high income)Europe & Central Asia (IDA & IBRD countries)European UnionFaroe IslandsFijiFinlandFragile and conflict affected situationsFranceFrench PolynesiaGabonGambia, TheGeorgiaGermanyGhanaGreeceGreenlandGrenadaGuamGuatemalaGuineaGuinea-BissauGuyanaHaitiHeavily indebted poor countries (HIPC)High incomeHondurasHong Kong SAR, ChinaHungaryIBRD onlyIcelandIDA & IBRD totalIDA blendIDA onlyIDA totalIndiaIndonesiaIran, Islamic Rep.IraqIrelandIsle of ManIsraelItalyJamaicaJapanJordanKazakhstanKenyaKiribatiKorea, Dem. People’s Rep.Korea, Rep.KosovoKuwaitKyrgyz RepublicLao PDRLate-demographic dividendLatin America & Caribbean Latin America & Caribbean (excluding high income)Latin America & the Caribbean (IDA & IBRD countries)LatviaLeast developed countries: UN classificationLebanonLesothoLiberiaLibyaLiechtensteinLithuaniaLow & middle incomeLow incomeLower middle incomeLuxembourgMacao SAR, ChinaMacedonia, FYRMadagascarMalawiMalaysiaMaldivesMaliMaltaMarshall IslandsMauritaniaMauritiusMexicoMicronesia, Fed. Sts.Middle East & North AfricaMiddle East & North Africa (excluding high income)Middle East & North Africa (IDA & IBRD countries)Middle incomeMoldovaMongoliaMontenegroMoroccoMozambiqueMyanmarNamibiaNepalNetherlandsNew CaledoniaNew ZealandNicaraguaNigerNigeriaNorth AmericaNorwayOECD membersOmanOther small statesPacific island small statesPakistanPalauPanamaPapua New GuineaParaguayPeruPhilippinesPolandPortugalPost-demographic dividendPre-demographic dividendPuerto RicoQatarRomaniaRussian FederationRwandaSamoaSan MarinoSao Tome and PrincipeSaudi ArabiaSenegalSerbiaSeychellesSierra LeoneSingaporeSint Maarten (Dutch part)Slovak RepublicSloveniaSmall statesSolomon IslandsSomaliaSouth AfricaSouth AsiaSouth Asia (IDA & IBRD)South SudanSpainSri LankaSt. Kitts and NevisSt. LuciaSt. Martin (French part)St. Vincent and the GrenadinesSub-Saharan Africa Sub-Saharan Africa (excluding high income)Sub-Saharan Africa (IDA & IBRD countries)SudanSurinameSwazilandSwedenSwitzerlandSyrian Arab RepublicTajikistanTanzaniaThailandTimor-LesteTogoTongaTrinidad and TobagoTunisiaTurkeyTurkmenistanUgandaUkraineUnited Arab EmiratesUnited KingdomUnited StatesUpper middle incomeUruguayUzbekistanVanuatuVenezuela, RBVietnamVirgin Islands (U.S.)West Bank and GazaWorldYemen, Rep.ZambiaZimbabwe Timeline:
This timeline shows a graph from 1961 to 2015 of Paraguay. No data until 1960. Number of actual observations by date: 55.
Source name:
World Development Indicators
Source organization:
Derived from male and female life expectancy at birth from sources such as: (1) United Nations Population Division. World Population Prospects, (2) Census reports and other statistical publications from national statistical offices, (3) Eurostat: Demographic Statistics, (4) United Nations Statistical Division. Population and Vital Statistics Reprot (various years), (5) U.S. Census Bureau: International Database, and (6) Secretariat of the Pacific Community: Statistics and Demography Programme.
Categories, topics:
Health
Last updated:
apr 23, 2017
Indicators value changes by year
Minimum:
63.794
jan 1, 1961
Maximum:
72.922
jan 1, 2015
At the date of observation
Value
Absolute change
Change from previous value
jan 1, 1961
63.794
+63.794
0.0%
jan 1, 1962
64.018
+0.225
0.35%
jan 1, 1963
64.227
+0.209
0.33%
jan 1, 1964
64.411
+0.184
0.29%
jan 1, 1965
64.57
+0.159
0.25%
jan 1, 1966
64.708
+0.138
0.21%
jan 1, 1967
64.836
+0.128
0.2%
jan 1, 1968
64.966
+0.131
0.2%
jan 1, 1969
65.109
+0.142
0.22%
jan 1, 1970
65.266
+0.157
0.24%
jan 1, 1971
65.433
+0.168
0.26%
jan 1, 1972
65.607
+0.173
0.26%
jan 1, 1973
65.775
+0.169
0.26%
jan 1, 1974
65.932
+0.157
0.24%
jan 1, 1975
66.076
+0.144
0.22%
jan 1, 1976
66.207
+0.131
0.2%
jan 1, 1977
66.326
+0.119
0.18%
jan 1, 1978
66.439
+0.113
0.17%
jan 1, 1979
66.55
+0.111
0.17%
jan 1, 1980
66.661
+0.111
0.17%
jan 1, 1981
66.771
+0.11
0.17%
jan 1, 1982
66.879
+0.108
0.16%
jan 1, 1983
66.984
+0.105
0.16%
jan 1, 1984
67.087
+0.103
0.15%
jan 1, 1985
67.189
+0.102
0.15%
jan 1, 1986
67.295
+0.106
0.16%
jan 1, 1987
67.411
+0.116
0.17%
jan 1, 1988
67.54
+0.129
0.19%
jan 1, 1989
67.683
+0.143
0.21%
jan 1, 1990
67.842
+0.159
0.23%
jan 1, 1991
68.013
+0.17
0.25%
jan 1, 1992
68.191
+0.178
0.26%
jan 1, 1993
68.37
+0.179
0.26%
jan 1, 1994
68.551
+0.18
0.26%
jan 1, 1995
68.731
+0.18
0.26%
jan 1, 1996
68.915
+0.184
0.27%
jan 1, 1997
69.113
+0.198
0.29%
jan 1, 1998
69.327
+0.214
0.31%
jan 1, 1999
69.561
+0.234
0.34%
jan 1, 2000
69.813
+0.251
0.36%
jan 1, 2001
70.075
+0.262
0.38%
jan 1, 2002
70.34
+0.265
0.38%
jan 1, 2003
70.597
+0.258
0.37%
jan 1, 2004
70.842
+0.245
0.35%
jan 1, 2005
71.071
+0.229
0.32%
jan 1, 2006
71.286
+0.215
0.3%
jan 1, 2007
71.492
+0.206
0.29%
jan 1, 2008
71.695
+0.203
0.28%
jan 1, 2009
71.899
+0.204
0.28%
jan 1, 2010
72.102
+0.203
0.28%
jan 1, 2011
72.301
+0.199
0.28%
jan 1, 2012
72.487
+0.186
0.26%
jan 1, 2013
72.654
+0.167
0.23%
jan 1, 2014
72.799
+0.145
0.2%
jan 1, 2015
72.922
+0.123
0.17%
Ranking of countries by current statistics by years


Comments: