29
/
en
AIzaSyAYiBZKx7MnpbEhh9jyipgxe19OcubqV5w
April 1, 2024
158612
Iraq
IRQ
true
2
1
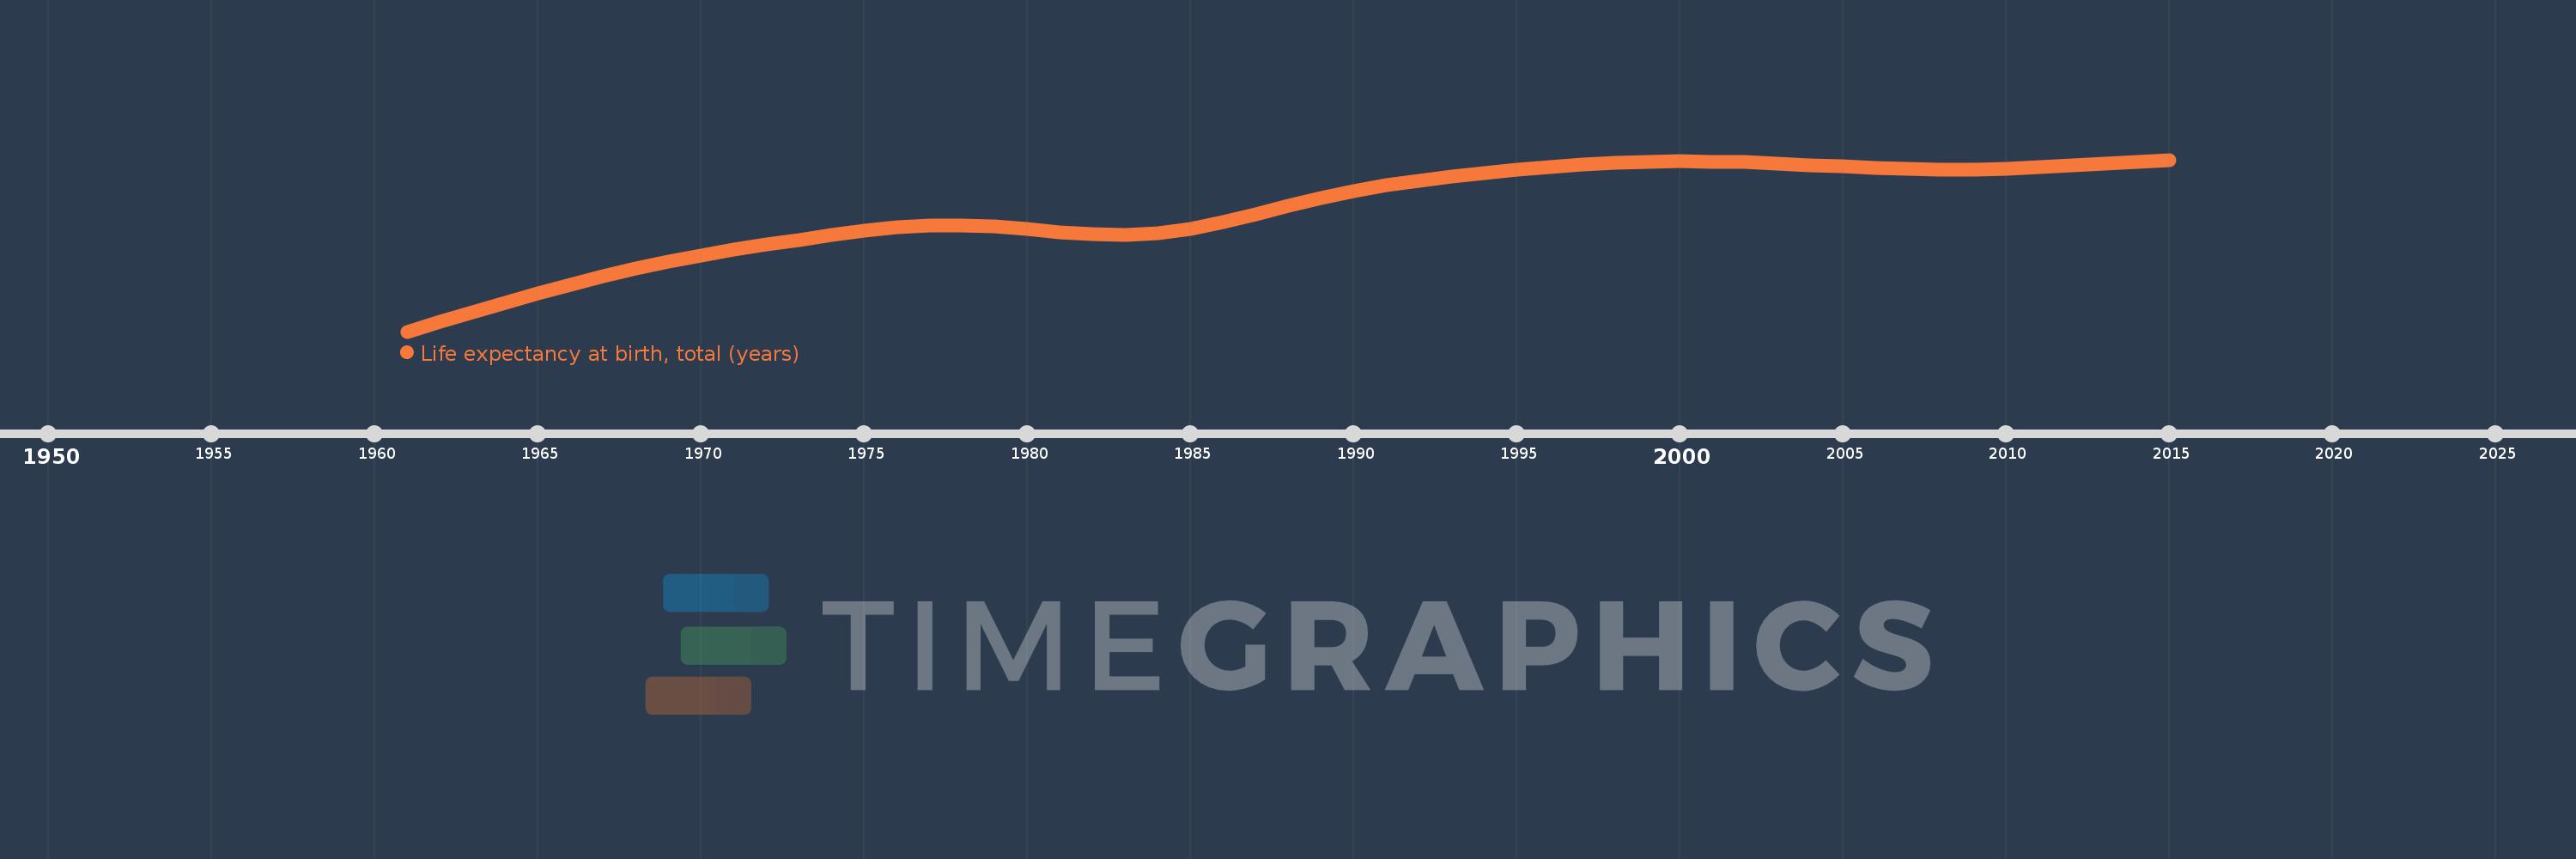
Life expectancy at birth, total (years)
2015,2014,2013,2012,2011,2010,2009,2008,2007,2006,2005,2004,2003,2002,2001,2000,1999,1998,1997,1996,1995,1994,1993,1992,1991,1990,1989,1988,1987,1986,1985,1984,1983,1982,1981,1980,1979,1978,1977,1976,1975,1974,1973,1972,1971,1970,1969,1968,1967,1966,1965,1964,1963,1962,1961
This statistics in other country:
AfghanistanAlbaniaAlgeriaAngolaAntigua and BarbudaArab WorldArgentinaArmeniaArubaAustraliaAustriaAzerbaijanBahamas, TheBahrainBangladeshBarbadosBelarusBelgiumBelizeBeninBermudaBhutanBoliviaBosnia and HerzegovinaBotswanaBrazilBrunei DarussalamBulgariaBurkina FasoBurundiCabo VerdeCambodiaCameroonCanadaCaribbean small statesCentral African RepublicCentral Europe and the BalticsChadChannel IslandsChileChinaColombiaComorosCongo, Dem. Rep.Congo, Rep.Costa RicaCote d'IvoireCroatiaCubaCuracaoCyprusCzech RepublicDenmarkDjiboutiDominicaDominican RepublicEarly-demographic dividendEast Asia & PacificEast Asia & Pacific (excluding high income)East Asia & Pacific (IDA & IBRD countries)EcuadorEgypt, Arab Rep.El SalvadorEquatorial GuineaEritreaEstoniaEthiopiaEuro areaEurope & Central AsiaEurope & Central Asia (excluding high income)Europe & Central Asia (IDA & IBRD countries)European UnionFaroe IslandsFijiFinlandFragile and conflict affected situationsFranceFrench PolynesiaGabonGambia, TheGeorgiaGermanyGhanaGreeceGreenlandGrenadaGuamGuatemalaGuineaGuinea-BissauGuyanaHaitiHeavily indebted poor countries (HIPC)High incomeHondurasHong Kong SAR, ChinaHungaryIBRD onlyIcelandIDA & IBRD totalIDA blendIDA onlyIDA totalIndiaIndonesiaIran, Islamic Rep.IraqIrelandIsle of ManIsraelItalyJamaicaJapanJordanKazakhstanKenyaKiribatiKorea, Dem. People’s Rep.Korea, Rep.KosovoKuwaitKyrgyz RepublicLao PDRLate-demographic dividendLatin America & Caribbean Latin America & Caribbean (excluding high income)Latin America & the Caribbean (IDA & IBRD countries)LatviaLeast developed countries: UN classificationLebanonLesothoLiberiaLibyaLiechtensteinLithuaniaLow & middle incomeLow incomeLower middle incomeLuxembourgMacao SAR, ChinaMacedonia, FYRMadagascarMalawiMalaysiaMaldivesMaliMaltaMarshall IslandsMauritaniaMauritiusMexicoMicronesia, Fed. Sts.Middle East & North AfricaMiddle East & North Africa (excluding high income)Middle East & North Africa (IDA & IBRD countries)Middle incomeMoldovaMongoliaMontenegroMoroccoMozambiqueMyanmarNamibiaNepalNetherlandsNew CaledoniaNew ZealandNicaraguaNigerNigeriaNorth AmericaNorwayOECD membersOmanOther small statesPacific island small statesPakistanPalauPanamaPapua New GuineaParaguayPeruPhilippinesPolandPortugalPost-demographic dividendPre-demographic dividendPuerto RicoQatarRomaniaRussian FederationRwandaSamoaSan MarinoSao Tome and PrincipeSaudi ArabiaSenegalSerbiaSeychellesSierra LeoneSingaporeSint Maarten (Dutch part)Slovak RepublicSloveniaSmall statesSolomon IslandsSomaliaSouth AfricaSouth AsiaSouth Asia (IDA & IBRD)South SudanSpainSri LankaSt. Kitts and NevisSt. LuciaSt. Martin (French part)St. Vincent and the GrenadinesSub-Saharan Africa Sub-Saharan Africa (excluding high income)Sub-Saharan Africa (IDA & IBRD countries)SudanSurinameSwazilandSwedenSwitzerlandSyrian Arab RepublicTajikistanTanzaniaThailandTimor-LesteTogoTongaTrinidad and TobagoTunisiaTurkeyTurkmenistanUgandaUkraineUnited Arab EmiratesUnited KingdomUnited StatesUpper middle incomeUruguayUzbekistanVanuatuVenezuela, RBVietnamVirgin Islands (U.S.)West Bank and GazaWorldYemen, Rep.ZambiaZimbabwe Timeline:
This timeline shows a graph from 1961 to 2015 of Iraq. No data until 1960. Number of actual observations by date: 55.
Source name:
World Development Indicators
Source organization:
Derived from male and female life expectancy at birth from sources such as: (1) United Nations Population Division. World Population Prospects, (2) Census reports and other statistical publications from national statistical offices, (3) Eurostat: Demographic Statistics, (4) United Nations Statistical Division. Population and Vital Statistics Reprot (various years), (5) U.S. Census Bureau: International Database, and (6) Secretariat of the Pacific Community: Statistics and Demography Programme.
Categories, topics:
Health
Last updated:
apr 23, 2017
Indicators value changes by year
Minimum:
48.031
jan 1, 1961
At the date of observation
Value
Absolute change
Change from previous value
jan 1, 1961
48.031
+48.031
0.0%
jan 1, 1962
49.232
+1.201
2.5%
jan 1, 1963
50.418
+1.187
2.41%
jan 1, 1964
51.589
+1.171
2.32%
jan 1, 1965
52.737
+1.147
2.22%
jan 1, 1966
53.843
+1.106
2.1%
jan 1, 1967
54.886
+1.043
1.94%
jan 1, 1968
55.849
+0.962
1.75%
jan 1, 1969
56.718
+0.869
1.56%
jan 1, 1970
57.492
+0.774
1.37%
jan 1, 1971
58.188
+0.695
1.21%
jan 1, 1972
58.831
+0.643
1.1%
jan 1, 1973
59.441
+0.61
1.04%
jan 1, 1974
60.022
+0.581
0.98%
jan 1, 1975
60.561
+0.539
0.9%
jan 1, 1976
60.996
+0.435
0.72%
jan 1, 1977
61.246
+0.249
0.41%
jan 1, 1978
61.275
+0.03
0.05%
jan 1, 1979
61.096
-0.179
-0.29%
jan 1, 1980
60.76
-0.337
-0.55%
jan 1, 1981
60.381
-0.379
-0.62%
jan 1, 1982
60.105
-0.276
-0.46%
jan 1, 1983
60.052
-0.053
-0.09%
jan 1, 1984
60.292
+0.24
0.4%
jan 1, 1985
60.841
+0.549
0.91%
jan 1, 1986
61.658
+0.818
1.34%
jan 1, 1987
62.657
+0.999
1.62%
jan 1, 1988
63.701
+1.044
1.67%
jan 1, 1989
64.676
+0.976
1.53%
jan 1, 1990
65.531
+0.855
1.32%
jan 1, 1991
66.24
+0.709
1.08%
jan 1, 1992
66.815
+0.574
0.87%
jan 1, 1993
67.305
+0.49
0.73%
jan 1, 1994
67.749
+0.444
0.66%
jan 1, 1995
68.148
+0.399
0.59%
jan 1, 1996
68.497
+0.349
0.51%
jan 1, 1997
68.783
+0.287
0.42%
jan 1, 1998
68.997
+0.214
0.31%
jan 1, 1999
69.132
+0.135
0.2%
jan 1, 2000
69.193
+0.061
0.09%
jan 1, 2001
69.179
-0.015
-0.02%
jan 1, 2002
69.09
-0.089
-0.13%
jan 1, 2003
68.942
-0.148
-0.21%
jan 1, 2004
68.757
-0.185
-0.27%
jan 1, 2005
68.56
-0.197
-0.29%
jan 1, 2006
68.382
-0.178
-0.26%
jan 1, 2007
68.257
-0.125
-0.18%
jan 1, 2008
68.199
-0.057
-0.08%
jan 1, 2009
68.22
+0.021
0.03%
jan 1, 2010
68.32
+0.1
0.15%
jan 1, 2011
68.49
+0.17
0.25%
jan 1, 2012
68.71
+0.22
0.32%
jan 1, 2013
68.95
+0.24
0.35%
jan 1, 2014
69.183
+0.234
0.34%
jan 1, 2015
69.4
+0.216
0.31%
Ranking of countries by current statistics by years


Comments: