29
/
en
AIzaSyAYiBZKx7MnpbEhh9jyipgxe19OcubqV5w
April 1, 2024
45255
Low & middle income
LMY
false
2
1
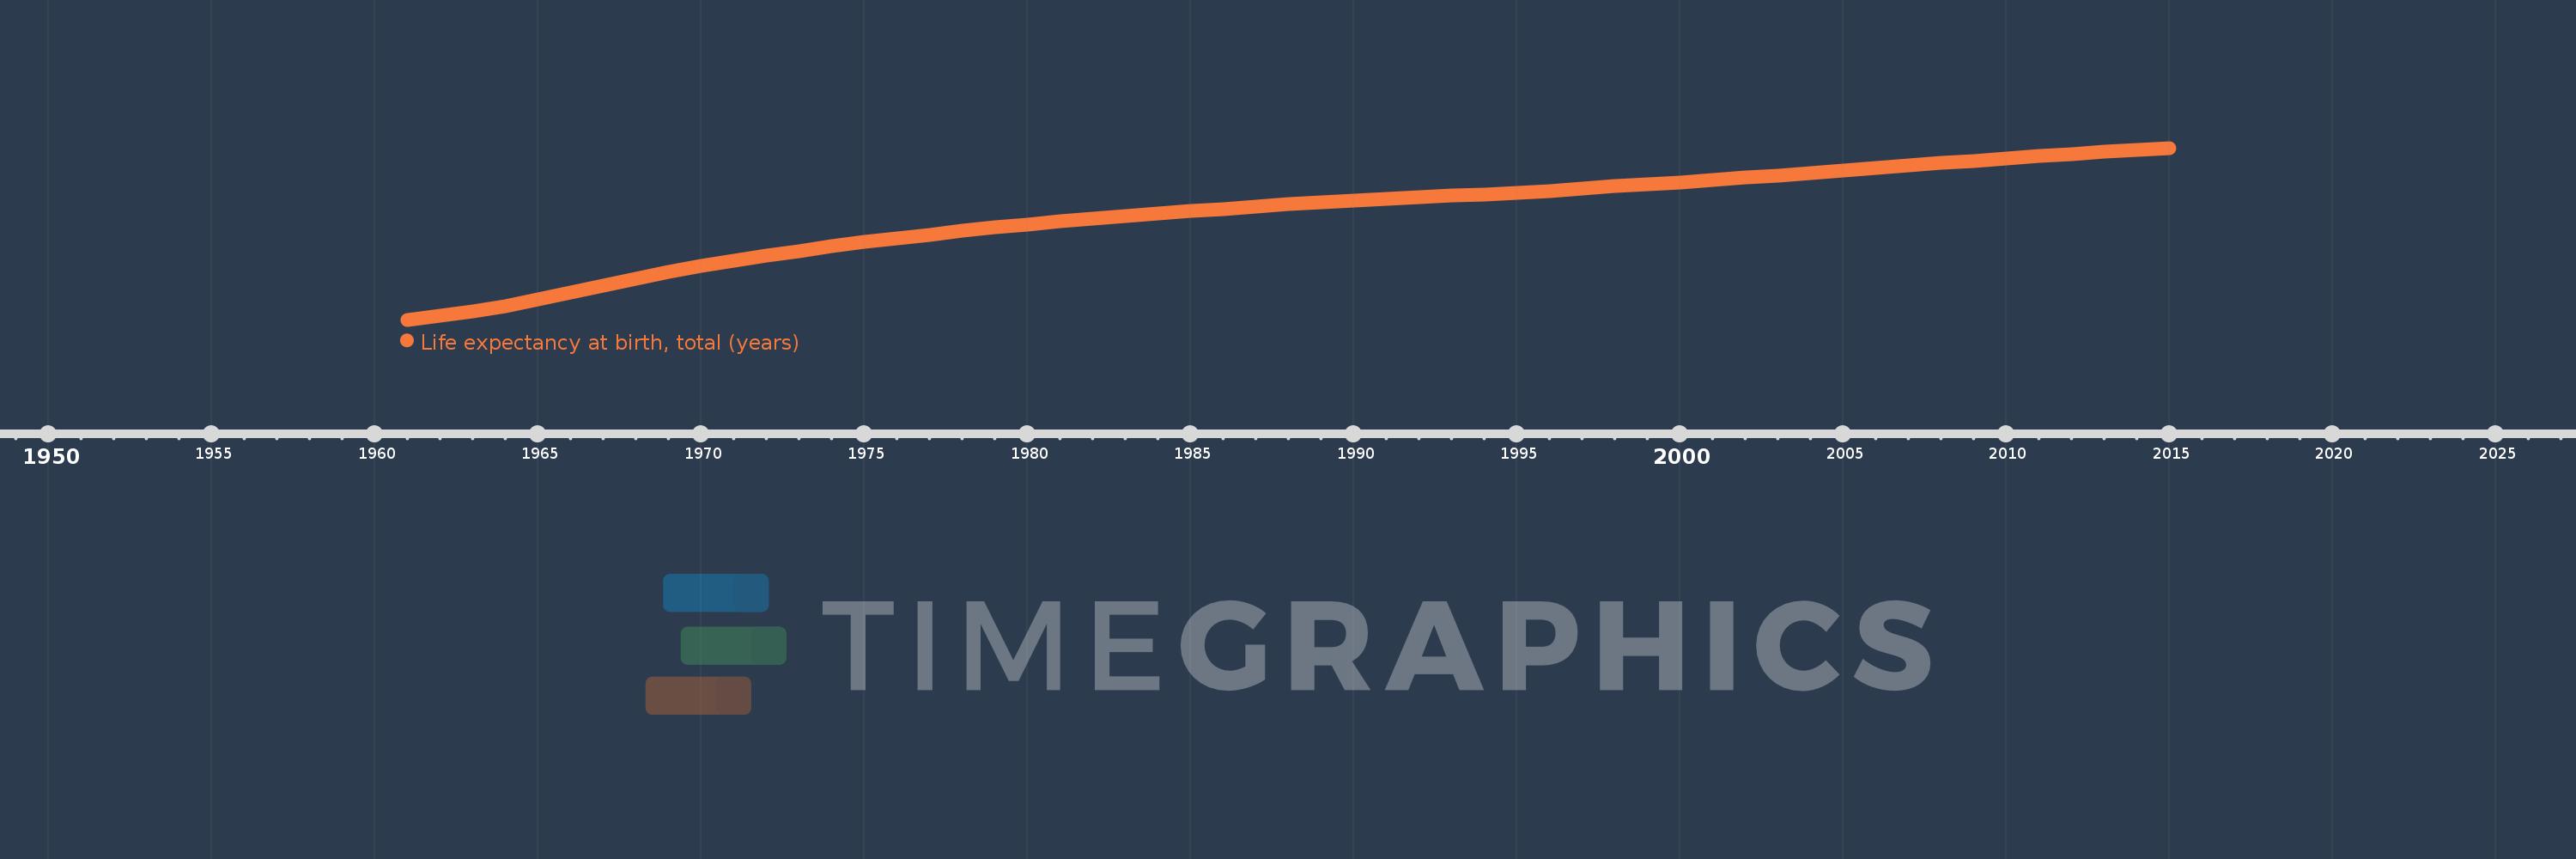
Life expectancy at birth, total (years)
2015,2014,2013,2012,2011,2010,2009,2008,2007,2006,2005,2004,2003,2002,2001,2000,1999,1998,1997,1996,1995,1994,1993,1992,1991,1990,1989,1988,1987,1986,1985,1984,1983,1982,1981,1980,1979,1978,1977,1976,1975,1974,1973,1972,1971,1970,1969,1968,1967,1966,1965,1964,1963,1962,1961
This statistics in other country:
AfghanistanAlbaniaAlgeriaAngolaAntigua and BarbudaArab WorldArgentinaArmeniaArubaAustraliaAustriaAzerbaijanBahamas, TheBahrainBangladeshBarbadosBelarusBelgiumBelizeBeninBermudaBhutanBoliviaBosnia and HerzegovinaBotswanaBrazilBrunei DarussalamBulgariaBurkina FasoBurundiCabo VerdeCambodiaCameroonCanadaCaribbean small statesCentral African RepublicCentral Europe and the BalticsChadChannel IslandsChileChinaColombiaComorosCongo, Dem. Rep.Congo, Rep.Costa RicaCote d'IvoireCroatiaCubaCuracaoCyprusCzech RepublicDenmarkDjiboutiDominicaDominican RepublicEarly-demographic dividendEast Asia & PacificEast Asia & Pacific (excluding high income)East Asia & Pacific (IDA & IBRD countries)EcuadorEgypt, Arab Rep.El SalvadorEquatorial GuineaEritreaEstoniaEthiopiaEuro areaEurope & Central AsiaEurope & Central Asia (excluding high income)Europe & Central Asia (IDA & IBRD countries)European UnionFaroe IslandsFijiFinlandFragile and conflict affected situationsFranceFrench PolynesiaGabonGambia, TheGeorgiaGermanyGhanaGreeceGreenlandGrenadaGuamGuatemalaGuineaGuinea-BissauGuyanaHaitiHeavily indebted poor countries (HIPC)High incomeHondurasHong Kong SAR, ChinaHungaryIBRD onlyIcelandIDA & IBRD totalIDA blendIDA onlyIDA totalIndiaIndonesiaIran, Islamic Rep.IraqIrelandIsle of ManIsraelItalyJamaicaJapanJordanKazakhstanKenyaKiribatiKorea, Dem. People’s Rep.Korea, Rep.KosovoKuwaitKyrgyz RepublicLao PDRLate-demographic dividendLatin America & Caribbean Latin America & Caribbean (excluding high income)Latin America & the Caribbean (IDA & IBRD countries)LatviaLeast developed countries: UN classificationLebanonLesothoLiberiaLibyaLiechtensteinLithuaniaLow & middle incomeLow incomeLower middle incomeLuxembourgMacao SAR, ChinaMacedonia, FYRMadagascarMalawiMalaysiaMaldivesMaliMaltaMarshall IslandsMauritaniaMauritiusMexicoMicronesia, Fed. Sts.Middle East & North AfricaMiddle East & North Africa (excluding high income)Middle East & North Africa (IDA & IBRD countries)Middle incomeMoldovaMongoliaMontenegroMoroccoMozambiqueMyanmarNamibiaNepalNetherlandsNew CaledoniaNew ZealandNicaraguaNigerNigeriaNorth AmericaNorwayOECD membersOmanOther small statesPacific island small statesPakistanPalauPanamaPapua New GuineaParaguayPeruPhilippinesPolandPortugalPost-demographic dividendPre-demographic dividendPuerto RicoQatarRomaniaRussian FederationRwandaSamoaSan MarinoSao Tome and PrincipeSaudi ArabiaSenegalSerbiaSeychellesSierra LeoneSingaporeSint Maarten (Dutch part)Slovak RepublicSloveniaSmall statesSolomon IslandsSomaliaSouth AfricaSouth AsiaSouth Asia (IDA & IBRD)South SudanSpainSri LankaSt. Kitts and NevisSt. LuciaSt. Martin (French part)St. Vincent and the GrenadinesSub-Saharan Africa Sub-Saharan Africa (excluding high income)Sub-Saharan Africa (IDA & IBRD countries)SudanSurinameSwazilandSwedenSwitzerlandSyrian Arab RepublicTajikistanTanzaniaThailandTimor-LesteTogoTongaTrinidad and TobagoTunisiaTurkeyTurkmenistanUgandaUkraineUnited Arab EmiratesUnited KingdomUnited StatesUpper middle incomeUruguayUzbekistanVanuatuVenezuela, RBVietnamVirgin Islands (U.S.)West Bank and GazaWorldYemen, Rep.ZambiaZimbabwe Timeline:
This timeline shows a graph from 1961 to 2015 of Low & middle income. No data until 1960. Number of actual observations by date: 55.
Source name:
World Development Indicators
Source organization:
Derived from male and female life expectancy at birth from sources such as: (1) United Nations Population Division. World Population Prospects, (2) Census reports and other statistical publications from national statistical offices, (3) Eurostat: Demographic Statistics, (4) United Nations Statistical Division. Population and Vital Statistics Reprot (various years), (5) U.S. Census Bureau: International Database, and (6) Secretariat of the Pacific Community: Statistics and Demography Programme.
Categories, topics:
Health
Last updated:
apr 23, 2017
Indicators value changes by year
Minimum:
47.142
jan 1, 1961
Maximum:
69.684
jan 1, 2015
At the date of observation
Value
Absolute change
Change from previous value
jan 1, 1961
47.142
+47.142
0.0%
jan 1, 1962
47.663
+0.521
1.11%
jan 1, 1963
48.262
+0.6
1.26%
jan 1, 1964
48.966
+0.704
1.46%
jan 1, 1965
49.785
+0.818
1.67%
jan 1, 1966
50.684
+0.9
1.81%
jan 1, 1967
51.619
+0.935
1.84%
jan 1, 1968
52.542
+0.922
1.79%
jan 1, 1969
53.414
+0.872
1.66%
jan 1, 1970
54.206
+0.792
1.48%
jan 1, 1971
54.933
+0.727
1.34%
jan 1, 1972
55.586
+0.652
1.19%
jan 1, 1973
56.176
+0.591
1.06%
jan 1, 1974
56.752
+0.576
1.02%
jan 1, 1975
57.309
+0.557
0.98%
jan 1, 1976
57.818
+0.509
0.89%
jan 1, 1977
58.321
+0.504
0.87%
jan 1, 1978
58.798
+0.477
0.82%
jan 1, 1979
59.248
+0.45
0.76%
jan 1, 1980
59.651
+0.403
0.68%
jan 1, 1981
60.038
+0.387
0.65%
jan 1, 1982
60.406
+0.368
0.61%
jan 1, 1983
60.761
+0.356
0.59%
jan 1, 1984
61.078
+0.316
0.52%
jan 1, 1985
61.367
+0.289
0.47%
jan 1, 1986
61.685
+0.319
0.52%
jan 1, 1987
62.028
+0.342
0.56%
jan 1, 1988
62.307
+0.279
0.45%
jan 1, 1989
62.567
+0.26
0.42%
jan 1, 1990
62.808
+0.241
0.38%
jan 1, 1991
63.04
+0.232
0.37%
jan 1, 1992
63.259
+0.219
0.35%
jan 1, 1993
63.425
+0.166
0.26%
jan 1, 1994
63.581
+0.156
0.25%
jan 1, 1995
63.794
+0.213
0.33%
jan 1, 1996
64.055
+0.261
0.41%
jan 1, 1997
64.336
+0.282
0.44%
jan 1, 1998
64.644
+0.308
0.48%
jan 1, 1999
64.917
+0.274
0.42%
jan 1, 2000
65.192
+0.274
0.42%
jan 1, 2001
65.477
+0.286
0.44%
jan 1, 2002
65.788
+0.311
0.48%
jan 1, 2003
66.082
+0.294
0.45%
jan 1, 2004
66.391
+0.309
0.47%
jan 1, 2005
66.714
+0.323
0.49%
jan 1, 2006
67.021
+0.308
0.46%
jan 1, 2007
67.361
+0.34
0.51%
jan 1, 2008
67.689
+0.327
0.49%
jan 1, 2009
67.995
+0.307
0.45%
jan 1, 2010
68.317
+0.322
0.47%
jan 1, 2011
68.61
+0.294
0.43%
jan 1, 2012
68.908
+0.297
0.43%
jan 1, 2013
69.187
+0.279
0.41%
jan 1, 2014
69.442
+0.255
0.37%
jan 1, 2015
69.684
+0.242
0.35%
Ranking of countries by current statistics by years


Comments: