29
/
en
AIzaSyAYiBZKx7MnpbEhh9jyipgxe19OcubqV5w
April 1, 2024
208810
New Caledonia
NCL
true
2
1
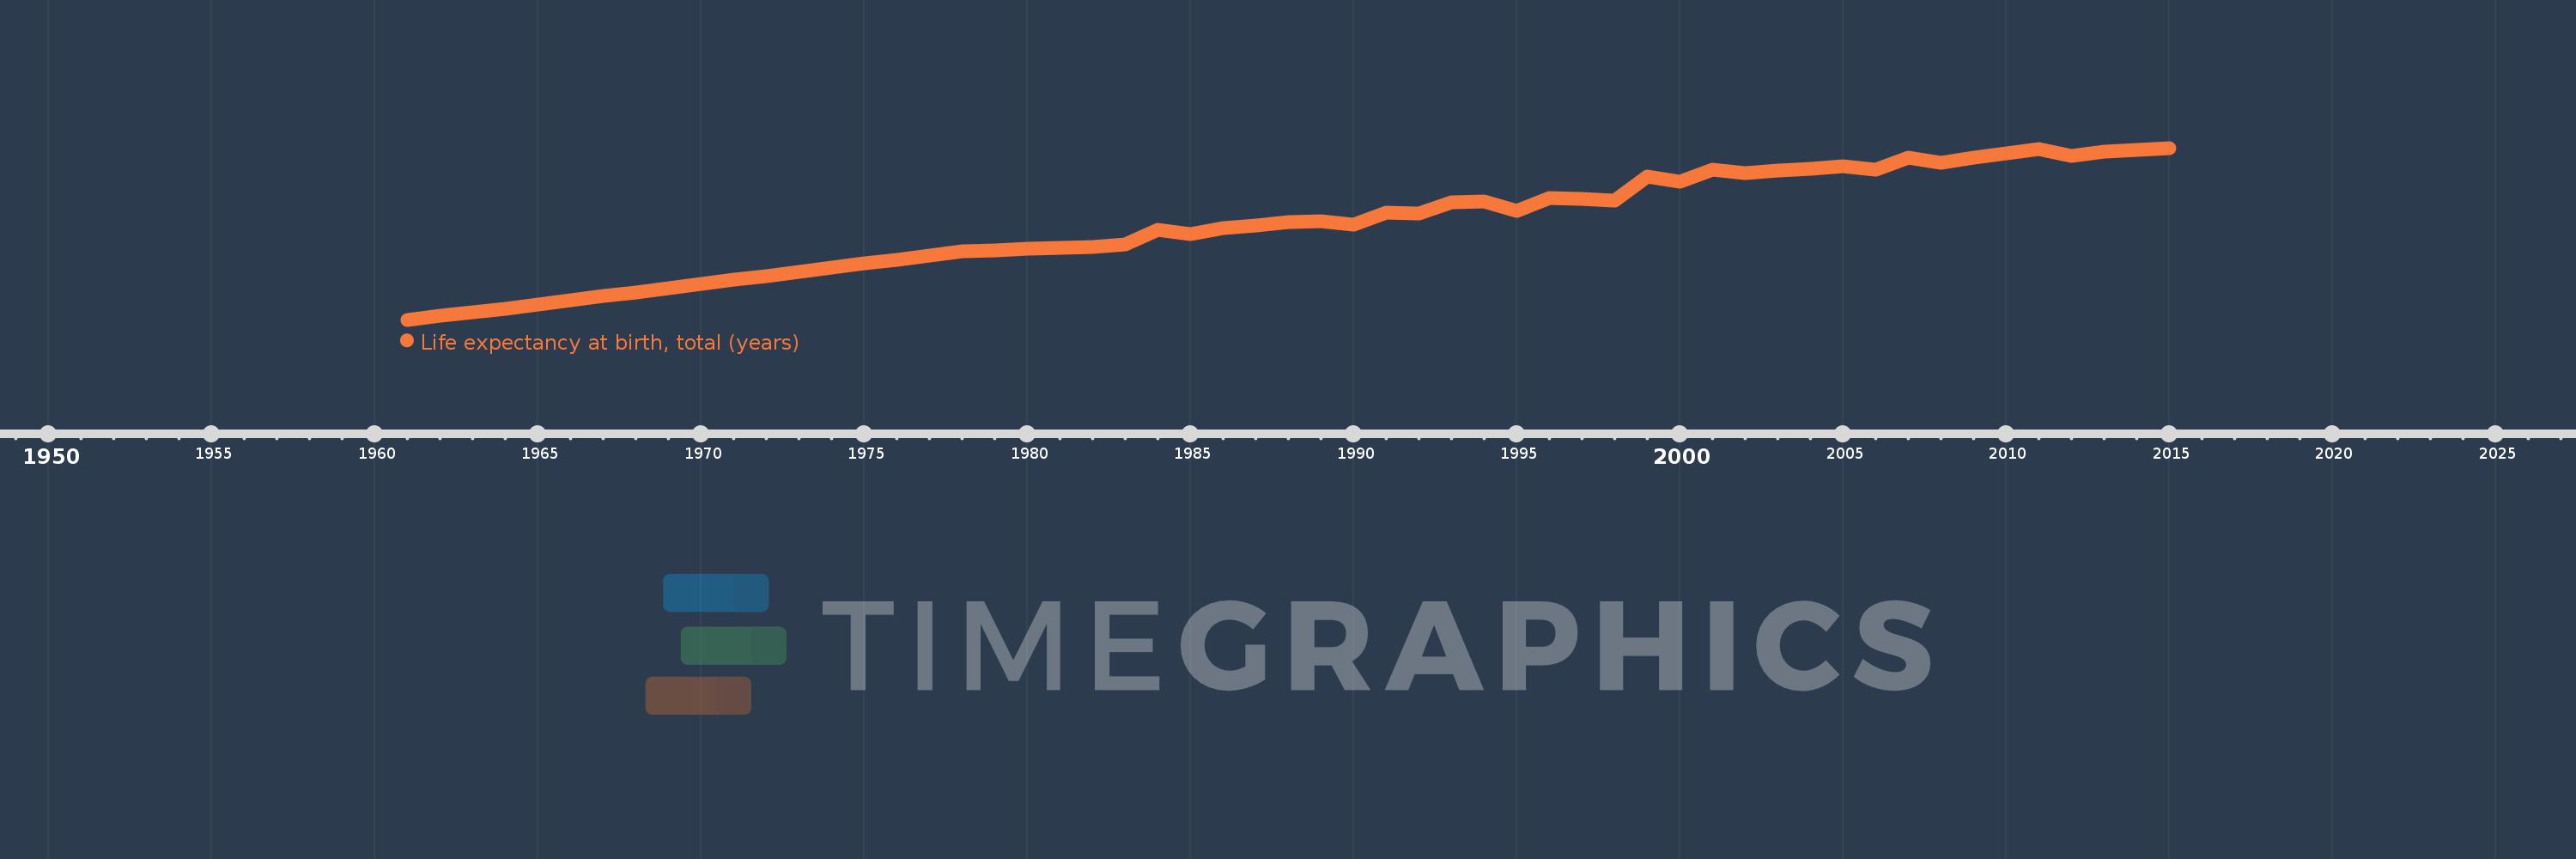
Life expectancy at birth, total (years)
2015,2014,2013,2012,2011,2010,2009,2008,2007,2006,2005,2004,2003,2002,2001,2000,1999,1998,1997,1996,1995,1994,1993,1992,1991,1990,1989,1988,1987,1986,1985,1984,1983,1982,1981,1980,1979,1978,1977,1976,1975,1974,1973,1972,1971,1970,1969,1968,1967,1966,1965,1964,1963,1962,1961
This statistics in other country:
AfghanistanAlbaniaAlgeriaAngolaAntigua and BarbudaArab WorldArgentinaArmeniaArubaAustraliaAustriaAzerbaijanBahamas, TheBahrainBangladeshBarbadosBelarusBelgiumBelizeBeninBermudaBhutanBoliviaBosnia and HerzegovinaBotswanaBrazilBrunei DarussalamBulgariaBurkina FasoBurundiCabo VerdeCambodiaCameroonCanadaCaribbean small statesCentral African RepublicCentral Europe and the BalticsChadChannel IslandsChileChinaColombiaComorosCongo, Dem. Rep.Congo, Rep.Costa RicaCote d'IvoireCroatiaCubaCuracaoCyprusCzech RepublicDenmarkDjiboutiDominicaDominican RepublicEarly-demographic dividendEast Asia & PacificEast Asia & Pacific (excluding high income)East Asia & Pacific (IDA & IBRD countries)EcuadorEgypt, Arab Rep.El SalvadorEquatorial GuineaEritreaEstoniaEthiopiaEuro areaEurope & Central AsiaEurope & Central Asia (excluding high income)Europe & Central Asia (IDA & IBRD countries)European UnionFaroe IslandsFijiFinlandFragile and conflict affected situationsFranceFrench PolynesiaGabonGambia, TheGeorgiaGermanyGhanaGreeceGreenlandGrenadaGuamGuatemalaGuineaGuinea-BissauGuyanaHaitiHeavily indebted poor countries (HIPC)High incomeHondurasHong Kong SAR, ChinaHungaryIBRD onlyIcelandIDA & IBRD totalIDA blendIDA onlyIDA totalIndiaIndonesiaIran, Islamic Rep.IraqIrelandIsle of ManIsraelItalyJamaicaJapanJordanKazakhstanKenyaKiribatiKorea, Dem. People’s Rep.Korea, Rep.KosovoKuwaitKyrgyz RepublicLao PDRLate-demographic dividendLatin America & Caribbean Latin America & Caribbean (excluding high income)Latin America & the Caribbean (IDA & IBRD countries)LatviaLeast developed countries: UN classificationLebanonLesothoLiberiaLibyaLiechtensteinLithuaniaLow & middle incomeLow incomeLower middle incomeLuxembourgMacao SAR, ChinaMacedonia, FYRMadagascarMalawiMalaysiaMaldivesMaliMaltaMarshall IslandsMauritaniaMauritiusMexicoMicronesia, Fed. Sts.Middle East & North AfricaMiddle East & North Africa (excluding high income)Middle East & North Africa (IDA & IBRD countries)Middle incomeMoldovaMongoliaMontenegroMoroccoMozambiqueMyanmarNamibiaNepalNetherlandsNew CaledoniaNew ZealandNicaraguaNigerNigeriaNorth AmericaNorwayOECD membersOmanOther small statesPacific island small statesPakistanPalauPanamaPapua New GuineaParaguayPeruPhilippinesPolandPortugalPost-demographic dividendPre-demographic dividendPuerto RicoQatarRomaniaRussian FederationRwandaSamoaSan MarinoSao Tome and PrincipeSaudi ArabiaSenegalSerbiaSeychellesSierra LeoneSingaporeSint Maarten (Dutch part)Slovak RepublicSloveniaSmall statesSolomon IslandsSomaliaSouth AfricaSouth AsiaSouth Asia (IDA & IBRD)South SudanSpainSri LankaSt. Kitts and NevisSt. LuciaSt. Martin (French part)St. Vincent and the GrenadinesSub-Saharan Africa Sub-Saharan Africa (excluding high income)Sub-Saharan Africa (IDA & IBRD countries)SudanSurinameSwazilandSwedenSwitzerlandSyrian Arab RepublicTajikistanTanzaniaThailandTimor-LesteTogoTongaTrinidad and TobagoTunisiaTurkeyTurkmenistanUgandaUkraineUnited Arab EmiratesUnited KingdomUnited StatesUpper middle incomeUruguayUzbekistanVanuatuVenezuela, RBVietnamVirgin Islands (U.S.)West Bank and GazaWorldYemen, Rep.ZambiaZimbabwe Timeline:
This timeline shows a graph from 1961 to 2015 of New Caledonia. No data until 1960. Number of actual observations by date: 55.
Source name:
World Development Indicators
Source organization:
Derived from male and female life expectancy at birth from sources such as: (1) United Nations Population Division. World Population Prospects, (2) Census reports and other statistical publications from national statistical offices, (3) Eurostat: Demographic Statistics, (4) United Nations Statistical Division. Population and Vital Statistics Reprot (various years), (5) U.S. Census Bureau: International Database, and (6) Secretariat of the Pacific Community: Statistics and Demography Programme.
Categories, topics:
Health
Last updated:
apr 23, 2017
Indicators value changes by year
Minimum:
58.639
jan 1, 1961
Maximum:
77.573
jan 1, 2015
At the date of observation
Value
Absolute change
Change from previous value
jan 1, 1961
58.639
+58.639
0.0%
jan 1, 1962
59.039
+0.4
0.68%
jan 1, 1963
59.439
+0.4
0.68%
jan 1, 1964
59.888
+0.449
0.76%
jan 1, 1965
60.337
+0.449
0.75%
jan 1, 1966
60.785
+0.449
0.74%
jan 1, 1967
61.234
+0.449
0.74%
jan 1, 1968
61.683
+0.449
0.73%
jan 1, 1969
62.132
+0.449
0.73%
jan 1, 1970
62.58
+0.449
0.72%
jan 1, 1971
63.029
+0.449
0.72%
jan 1, 1972
63.478
+0.449
0.71%
jan 1, 1973
63.927
+0.449
0.71%
jan 1, 1974
64.376
+0.449
0.7%
jan 1, 1975
64.824
+0.449
0.7%
jan 1, 1976
65.273
+0.449
0.69%
jan 1, 1977
65.722
+0.449
0.69%
jan 1, 1978
66.171
+0.449
0.68%
jan 1, 1979
66.304
+0.133
0.2%
jan 1, 1980
66.437
+0.133
0.2%
jan 1, 1981
66.57
+0.133
0.2%
jan 1, 1982
66.702
+0.133
0.2%
jan 1, 1983
66.92
+0.217
0.33%
jan 1, 1984
68.588
+1.668
2.49%
jan 1, 1985
68.063
-0.524
-0.76%
jan 1, 1986
68.766
+0.702
1.03%
jan 1, 1987
69.063
+0.298
0.43%
jan 1, 1988
69.427
+0.363
0.53%
jan 1, 1989
69.454
+0.027
0.04%
jan 1, 1990
69.085
-0.368
-0.53%
jan 1, 1991
70.485
+1.4
2.03%
jan 1, 1992
70.359
-0.127
-0.18%
jan 1, 1993
71.615
+1.256
1.79%
jan 1, 1994
71.656
+0.041
0.06%
jan 1, 1995
70.673
-0.983
-1.37%
jan 1, 1996
72.01
+1.337
1.89%
jan 1, 1997
71.998
-0.012
-0.02%
jan 1, 1998
71.739
-0.259
-0.36%
jan 1, 1999
74.376
+2.637
3.68%
jan 1, 2000
73.876
-0.5
-0.67%
jan 1, 2001
75.163
+1.288
1.74%
jan 1, 2002
74.832
-0.332
-0.44%
jan 1, 2003
75.102
+0.271
0.36%
jan 1, 2004
75.271
+0.168
0.22%
jan 1, 2005
75.515
+0.244
0.32%
jan 1, 2006
75.168
-0.346
-0.46%
jan 1, 2007
76.461
+1.293
1.72%
jan 1, 2008
75.946
-0.515
-0.67%
jan 1, 2009
76.456
+0.51
0.67%
jan 1, 2010
76.966
+0.51
0.67%
jan 1, 2011
77.473
+0.507
0.66%
jan 1, 2012
76.727
-0.746
-0.96%
jan 1, 2013
77.122
+0.395
0.51%
jan 1, 2014
77.322
+0.2
0.26%
jan 1, 2015
77.573
+0.251
0.32%
Ranking of countries by current statistics by years


Comments: