29
/
en
AIzaSyAYiBZKx7MnpbEhh9jyipgxe19OcubqV5w
April 1, 2024
186739
Malawi
MWI
true
2
1
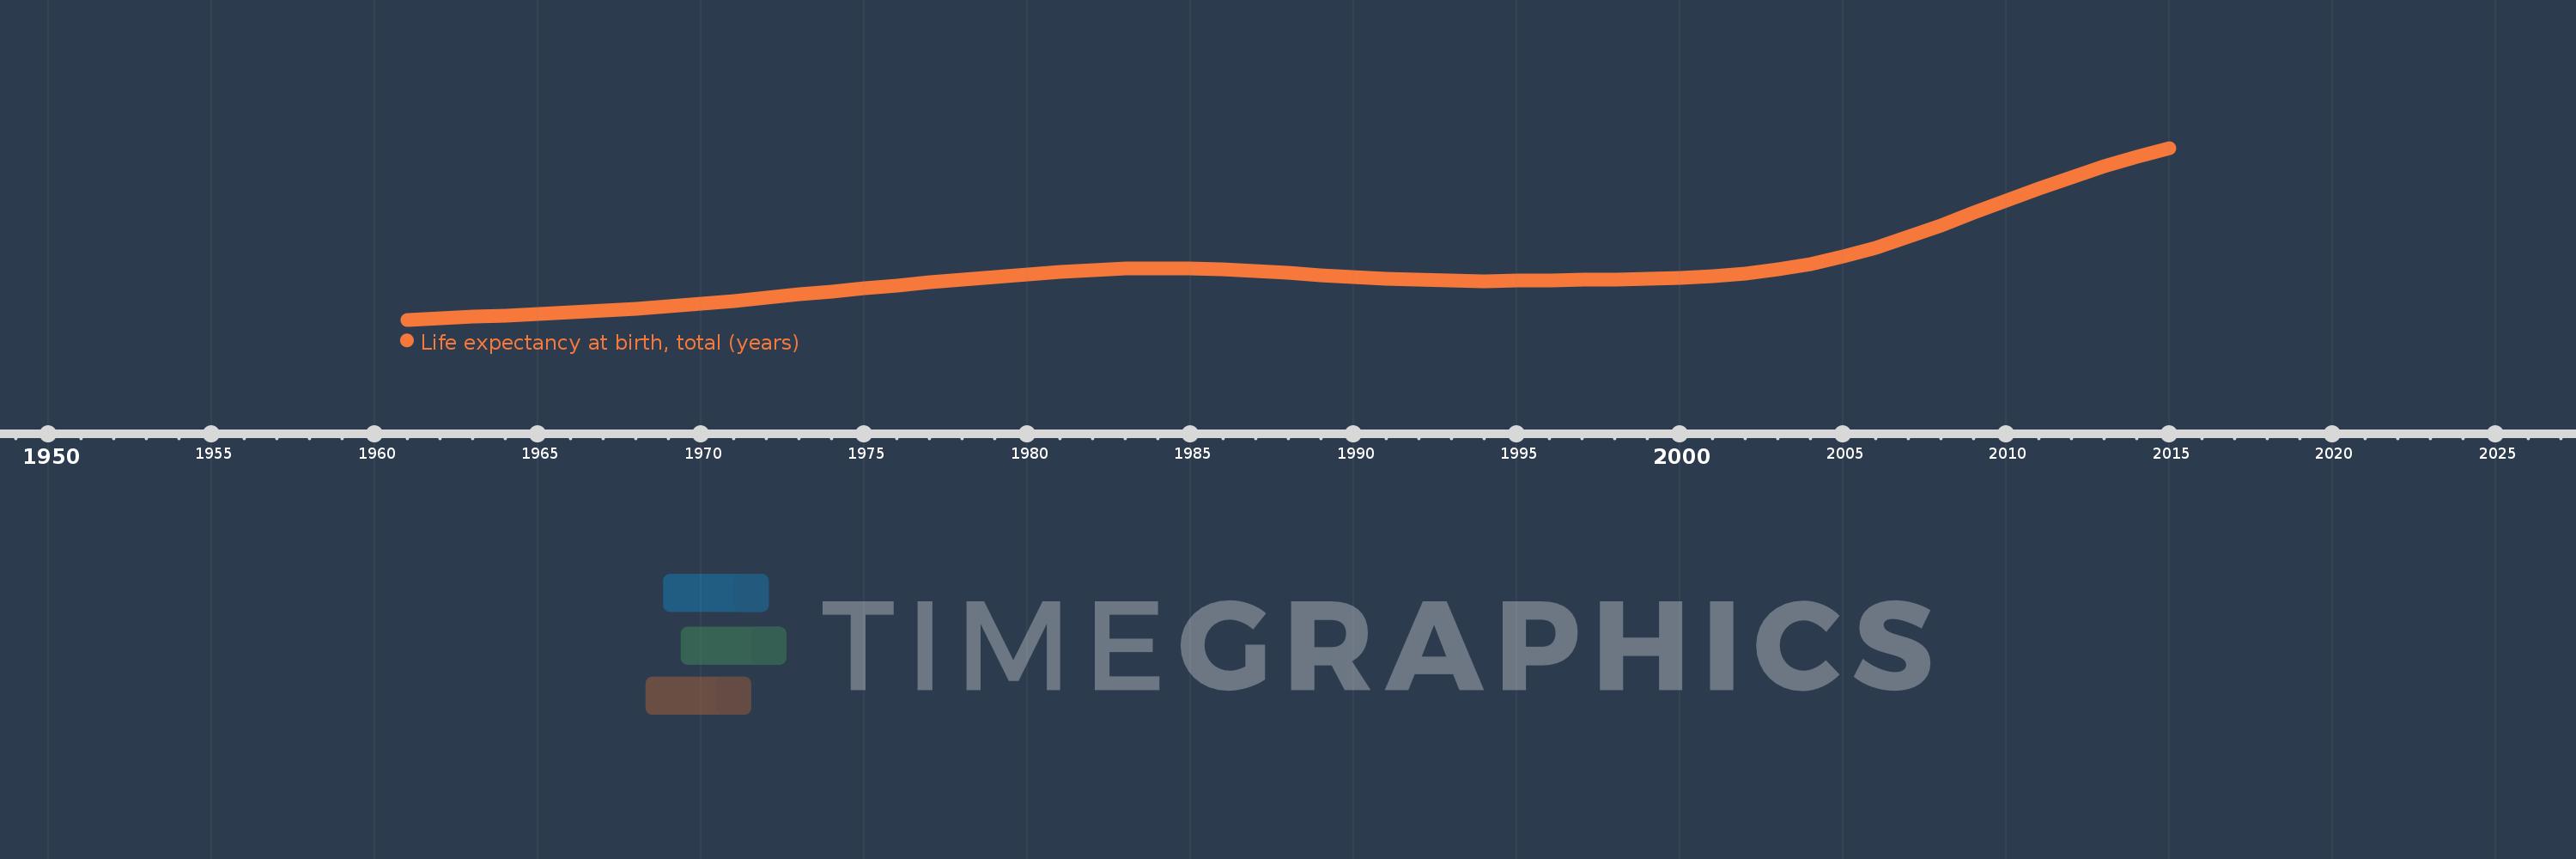
Life expectancy at birth, total (years)
2015,2014,2013,2012,2011,2010,2009,2008,2007,2006,2005,2004,2003,2002,2001,2000,1999,1998,1997,1996,1995,1994,1993,1992,1991,1990,1989,1988,1987,1986,1985,1984,1983,1982,1981,1980,1979,1978,1977,1976,1975,1974,1973,1972,1971,1970,1969,1968,1967,1966,1965,1964,1963,1962,1961
This statistics in other country:
AfghanistanAlbaniaAlgeriaAngolaAntigua and BarbudaArab WorldArgentinaArmeniaArubaAustraliaAustriaAzerbaijanBahamas, TheBahrainBangladeshBarbadosBelarusBelgiumBelizeBeninBermudaBhutanBoliviaBosnia and HerzegovinaBotswanaBrazilBrunei DarussalamBulgariaBurkina FasoBurundiCabo VerdeCambodiaCameroonCanadaCaribbean small statesCentral African RepublicCentral Europe and the BalticsChadChannel IslandsChileChinaColombiaComorosCongo, Dem. Rep.Congo, Rep.Costa RicaCote d'IvoireCroatiaCubaCuracaoCyprusCzech RepublicDenmarkDjiboutiDominicaDominican RepublicEarly-demographic dividendEast Asia & PacificEast Asia & Pacific (excluding high income)East Asia & Pacific (IDA & IBRD countries)EcuadorEgypt, Arab Rep.El SalvadorEquatorial GuineaEritreaEstoniaEthiopiaEuro areaEurope & Central AsiaEurope & Central Asia (excluding high income)Europe & Central Asia (IDA & IBRD countries)European UnionFaroe IslandsFijiFinlandFragile and conflict affected situationsFranceFrench PolynesiaGabonGambia, TheGeorgiaGermanyGhanaGreeceGreenlandGrenadaGuamGuatemalaGuineaGuinea-BissauGuyanaHaitiHeavily indebted poor countries (HIPC)High incomeHondurasHong Kong SAR, ChinaHungaryIBRD onlyIcelandIDA & IBRD totalIDA blendIDA onlyIDA totalIndiaIndonesiaIran, Islamic Rep.IraqIrelandIsle of ManIsraelItalyJamaicaJapanJordanKazakhstanKenyaKiribatiKorea, Dem. People’s Rep.Korea, Rep.KosovoKuwaitKyrgyz RepublicLao PDRLate-demographic dividendLatin America & Caribbean Latin America & Caribbean (excluding high income)Latin America & the Caribbean (IDA & IBRD countries)LatviaLeast developed countries: UN classificationLebanonLesothoLiberiaLibyaLiechtensteinLithuaniaLow & middle incomeLow incomeLower middle incomeLuxembourgMacao SAR, ChinaMacedonia, FYRMadagascarMalawiMalaysiaMaldivesMaliMaltaMarshall IslandsMauritaniaMauritiusMexicoMicronesia, Fed. Sts.Middle East & North AfricaMiddle East & North Africa (excluding high income)Middle East & North Africa (IDA & IBRD countries)Middle incomeMoldovaMongoliaMontenegroMoroccoMozambiqueMyanmarNamibiaNepalNetherlandsNew CaledoniaNew ZealandNicaraguaNigerNigeriaNorth AmericaNorwayOECD membersOmanOther small statesPacific island small statesPakistanPalauPanamaPapua New GuineaParaguayPeruPhilippinesPolandPortugalPost-demographic dividendPre-demographic dividendPuerto RicoQatarRomaniaRussian FederationRwandaSamoaSan MarinoSao Tome and PrincipeSaudi ArabiaSenegalSerbiaSeychellesSierra LeoneSingaporeSint Maarten (Dutch part)Slovak RepublicSloveniaSmall statesSolomon IslandsSomaliaSouth AfricaSouth AsiaSouth Asia (IDA & IBRD)South SudanSpainSri LankaSt. Kitts and NevisSt. LuciaSt. Martin (French part)St. Vincent and the GrenadinesSub-Saharan Africa Sub-Saharan Africa (excluding high income)Sub-Saharan Africa (IDA & IBRD countries)SudanSurinameSwazilandSwedenSwitzerlandSyrian Arab RepublicTajikistanTanzaniaThailandTimor-LesteTogoTongaTrinidad and TobagoTunisiaTurkeyTurkmenistanUgandaUkraineUnited Arab EmiratesUnited KingdomUnited StatesUpper middle incomeUruguayUzbekistanVanuatuVenezuela, RBVietnamVirgin Islands (U.S.)West Bank and GazaWorldYemen, Rep.ZambiaZimbabwe Timeline:
This timeline shows a graph from 1961 to 2015 of Malawi. No data until 1960. Number of actual observations by date: 55.
Source name:
World Development Indicators
Source organization:
Derived from male and female life expectancy at birth from sources such as: (1) United Nations Population Division. World Population Prospects, (2) Census reports and other statistical publications from national statistical offices, (3) Eurostat: Demographic Statistics, (4) United Nations Statistical Division. Population and Vital Statistics Reprot (various years), (5) U.S. Census Bureau: International Database, and (6) Secretariat of the Pacific Community: Statistics and Demography Programme.
Categories, topics:
Health
Last updated:
apr 23, 2017
Indicators value changes by year
Minimum:
37.774
jan 1, 1961
Maximum:
62.722
jan 1, 2015
At the date of observation
Value
Absolute change
Change from previous value
jan 1, 1961
37.774
+37.774
0.0%
jan 1, 1962
37.998
+0.225
0.59%
jan 1, 1963
38.214
+0.216
0.57%
jan 1, 1964
38.422
+0.208
0.54%
jan 1, 1965
38.626
+0.204
0.53%
jan 1, 1966
38.841
+0.216
0.56%
jan 1, 1967
39.086
+0.245
0.63%
jan 1, 1968
39.371
+0.285
0.73%
jan 1, 1969
39.705
+0.334
0.85%
jan 1, 1970
40.086
+0.381
0.96%
jan 1, 1971
40.509
+0.423
1.06%
jan 1, 1972
40.963
+0.453
1.12%
jan 1, 1973
41.428
+0.465
1.14%
jan 1, 1974
41.889
+0.462
1.11%
jan 1, 1975
42.336
+0.447
1.07%
jan 1, 1976
42.768
+0.432
1.02%
jan 1, 1977
43.192
+0.424
0.99%
jan 1, 1978
43.611
+0.419
0.97%
jan 1, 1979
44.02
+0.409
0.94%
jan 1, 1980
44.405
+0.385
0.87%
jan 1, 1981
44.74
+0.335
0.75%
jan 1, 1982
44.998
+0.257
0.58%
jan 1, 1983
45.16
+0.162
0.36%
jan 1, 1984
45.22
+0.06
0.13%
jan 1, 1985
45.18
-0.04
-0.09%
jan 1, 1986
45.045
-0.135
-0.3%
jan 1, 1987
44.83
-0.215
-0.48%
jan 1, 1988
44.565
-0.265
-0.59%
jan 1, 1989
44.281
-0.283
-0.64%
jan 1, 1990
44.006
-0.275
-0.62%
jan 1, 1991
43.766
-0.24
-0.55%
jan 1, 1992
43.583
-0.183
-0.42%
jan 1, 1993
43.461
-0.122
-0.28%
jan 1, 1994
43.403
-0.057
-0.13%
jan 1, 1995
43.416
+0.013
0.03%
jan 1, 1996
43.479
+0.063
0.14%
jan 1, 1997
43.559
+0.08
0.18%
jan 1, 1998
43.643
+0.084
0.19%
jan 1, 1999
43.734
+0.091
0.21%
jan 1, 2000
43.862
+0.128
0.29%
jan 1, 2001
44.08
+0.218
0.5%
jan 1, 2002
44.459
+0.379
0.86%
jan 1, 2003
45.049
+0.59
1.33%
jan 1, 2004
45.88
+0.831
1.85%
jan 1, 2005
46.957
+1.077
2.35%
jan 1, 2006
48.276
+1.319
2.81%
jan 1, 2007
49.817
+1.541
3.19%
jan 1, 2008
51.512
+1.696
3.4%
jan 1, 2009
53.287
+1.775
3.45%
jan 1, 2010
55.082
+1.795
3.37%
jan 1, 2011
56.836
+1.754
3.18%
jan 1, 2012
58.5
+1.664
2.93%
jan 1, 2013
60.05
+1.55
2.65%
jan 1, 2014
61.466
+1.416
2.36%
jan 1, 2015
62.722
+1.256
2.04%
Ranking of countries by current statistics by years


Comments: