29
/
en
AIzaSyAYiBZKx7MnpbEhh9jyipgxe19OcubqV5w
April 1, 2024
241806
Slovak Republic
SVK
true
2
1
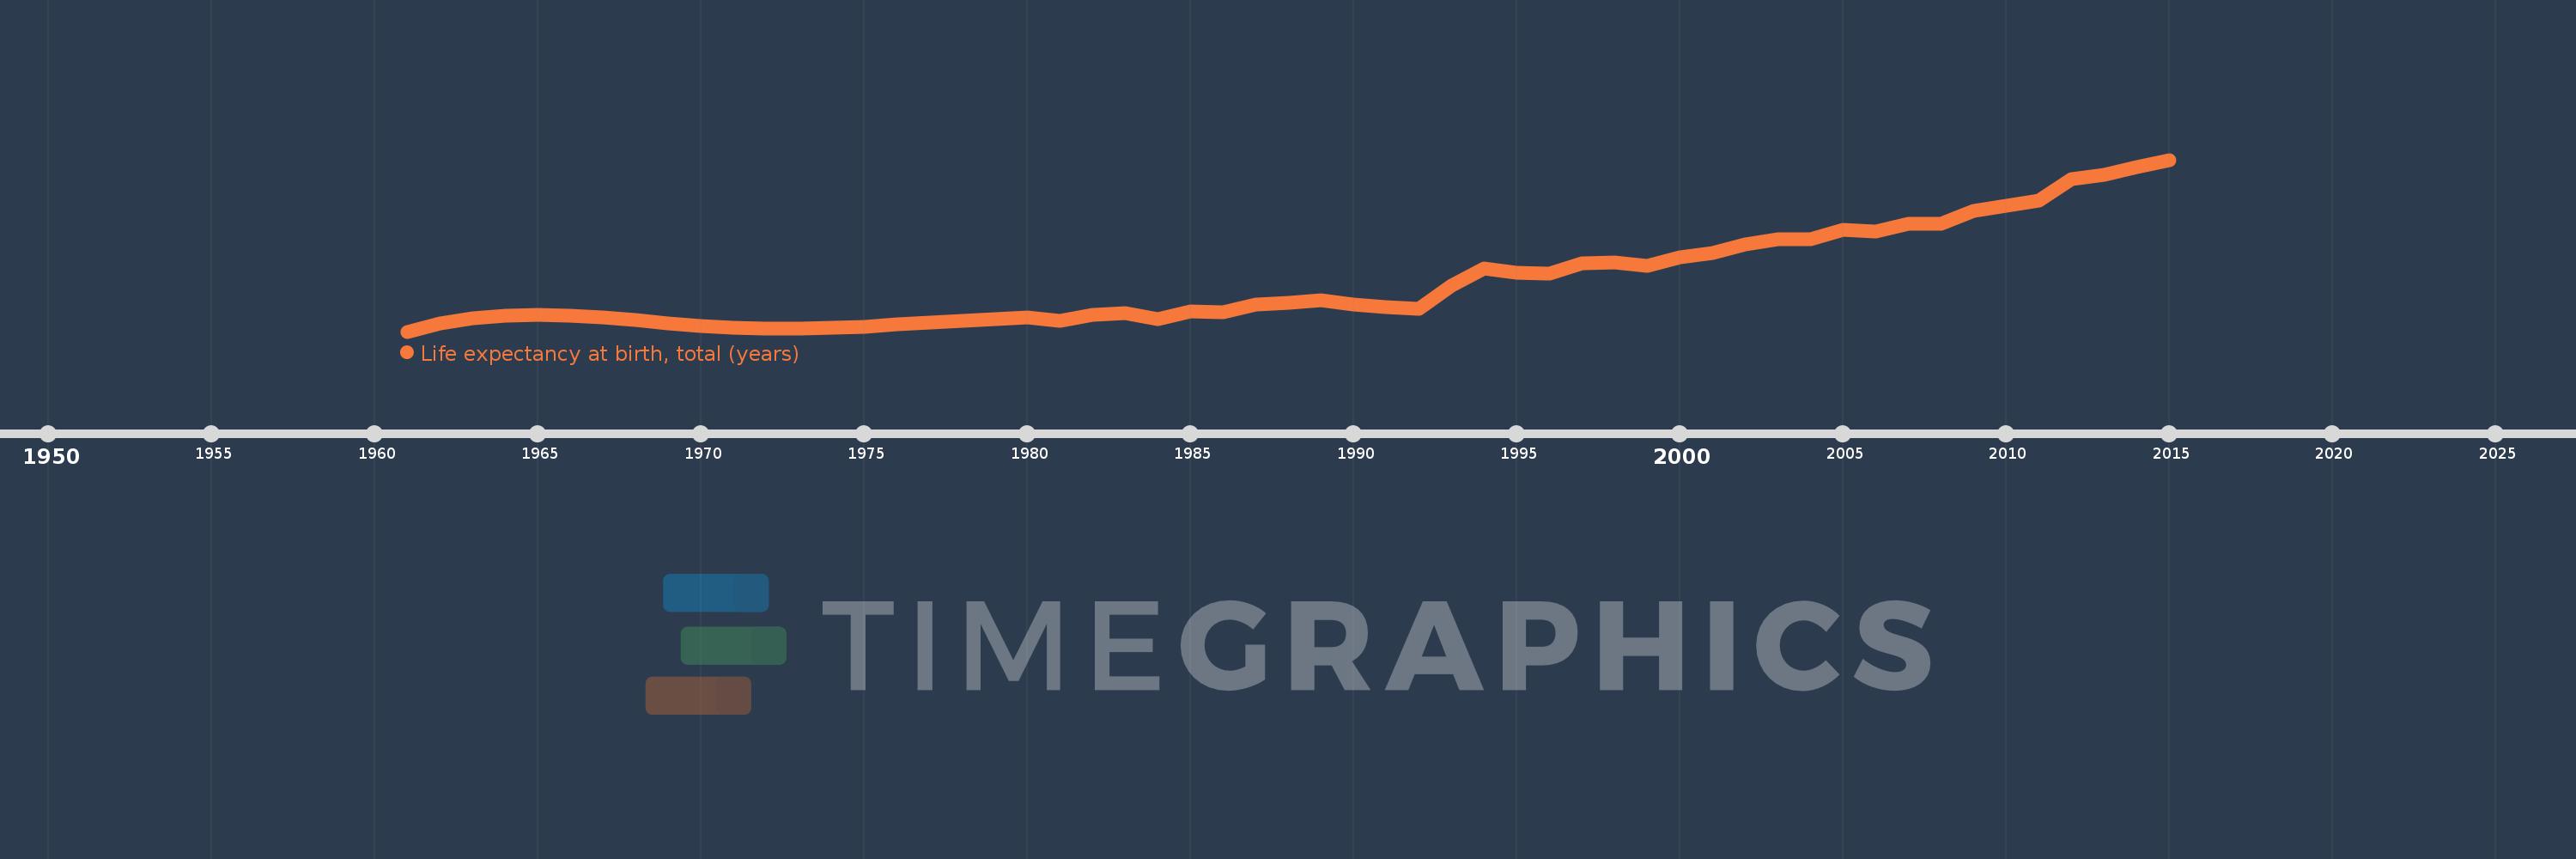
Life expectancy at birth, total (years)
2015,2014,2013,2012,2011,2010,2009,2008,2007,2006,2005,2004,2003,2002,2001,2000,1999,1998,1997,1996,1995,1994,1993,1992,1991,1990,1989,1988,1987,1986,1985,1984,1983,1982,1981,1980,1979,1978,1977,1976,1975,1974,1973,1972,1971,1970,1969,1968,1967,1966,1965,1964,1963,1962,1961
This statistics in other country:
AfghanistanAlbaniaAlgeriaAngolaAntigua and BarbudaArab WorldArgentinaArmeniaArubaAustraliaAustriaAzerbaijanBahamas, TheBahrainBangladeshBarbadosBelarusBelgiumBelizeBeninBermudaBhutanBoliviaBosnia and HerzegovinaBotswanaBrazilBrunei DarussalamBulgariaBurkina FasoBurundiCabo VerdeCambodiaCameroonCanadaCaribbean small statesCentral African RepublicCentral Europe and the BalticsChadChannel IslandsChileChinaColombiaComorosCongo, Dem. Rep.Congo, Rep.Costa RicaCote d'IvoireCroatiaCubaCuracaoCyprusCzech RepublicDenmarkDjiboutiDominicaDominican RepublicEarly-demographic dividendEast Asia & PacificEast Asia & Pacific (excluding high income)East Asia & Pacific (IDA & IBRD countries)EcuadorEgypt, Arab Rep.El SalvadorEquatorial GuineaEritreaEstoniaEthiopiaEuro areaEurope & Central AsiaEurope & Central Asia (excluding high income)Europe & Central Asia (IDA & IBRD countries)European UnionFaroe IslandsFijiFinlandFragile and conflict affected situationsFranceFrench PolynesiaGabonGambia, TheGeorgiaGermanyGhanaGreeceGreenlandGrenadaGuamGuatemalaGuineaGuinea-BissauGuyanaHaitiHeavily indebted poor countries (HIPC)High incomeHondurasHong Kong SAR, ChinaHungaryIBRD onlyIcelandIDA & IBRD totalIDA blendIDA onlyIDA totalIndiaIndonesiaIran, Islamic Rep.IraqIrelandIsle of ManIsraelItalyJamaicaJapanJordanKazakhstanKenyaKiribatiKorea, Dem. People’s Rep.Korea, Rep.KosovoKuwaitKyrgyz RepublicLao PDRLate-demographic dividendLatin America & Caribbean Latin America & Caribbean (excluding high income)Latin America & the Caribbean (IDA & IBRD countries)LatviaLeast developed countries: UN classificationLebanonLesothoLiberiaLibyaLiechtensteinLithuaniaLow & middle incomeLow incomeLower middle incomeLuxembourgMacao SAR, ChinaMacedonia, FYRMadagascarMalawiMalaysiaMaldivesMaliMaltaMarshall IslandsMauritaniaMauritiusMexicoMicronesia, Fed. Sts.Middle East & North AfricaMiddle East & North Africa (excluding high income)Middle East & North Africa (IDA & IBRD countries)Middle incomeMoldovaMongoliaMontenegroMoroccoMozambiqueMyanmarNamibiaNepalNetherlandsNew CaledoniaNew ZealandNicaraguaNigerNigeriaNorth AmericaNorwayOECD membersOmanOther small statesPacific island small statesPakistanPalauPanamaPapua New GuineaParaguayPeruPhilippinesPolandPortugalPost-demographic dividendPre-demographic dividendPuerto RicoQatarRomaniaRussian FederationRwandaSamoaSan MarinoSao Tome and PrincipeSaudi ArabiaSenegalSerbiaSeychellesSierra LeoneSingaporeSint Maarten (Dutch part)Slovak RepublicSloveniaSmall statesSolomon IslandsSomaliaSouth AfricaSouth AsiaSouth Asia (IDA & IBRD)South SudanSpainSri LankaSt. Kitts and NevisSt. LuciaSt. Martin (French part)St. Vincent and the GrenadinesSub-Saharan Africa Sub-Saharan Africa (excluding high income)Sub-Saharan Africa (IDA & IBRD countries)SudanSurinameSwazilandSwedenSwitzerlandSyrian Arab RepublicTajikistanTanzaniaThailandTimor-LesteTogoTongaTrinidad and TobagoTunisiaTurkeyTurkmenistanUgandaUkraineUnited Arab EmiratesUnited KingdomUnited StatesUpper middle incomeUruguayUzbekistanVanuatuVenezuela, RBVietnamVirgin Islands (U.S.)West Bank and GazaWorldYemen, Rep.ZambiaZimbabwe Timeline:
This timeline shows a graph from 1961 to 2015 of Slovak Republic. No data until 1960. Number of actual observations by date: 55.
Source name:
World Development Indicators
Source organization:
Derived from male and female life expectancy at birth from sources such as: (1) United Nations Population Division. World Population Prospects, (2) Census reports and other statistical publications from national statistical offices, (3) Eurostat: Demographic Statistics, (4) United Nations Statistical Division. Population and Vital Statistics Reprot (various years), (5) U.S. Census Bureau: International Database, and (6) Secretariat of the Pacific Community: Statistics and Demography Programme.
Categories, topics:
Health
Last updated:
apr 23, 2017
Indicators value changes by year
Minimum:
69.976
jan 1, 1961
Maximum:
76.715
jan 1, 2015
At the date of observation
Value
Absolute change
Change from previous value
jan 1, 1961
69.976
+69.976
0.0%
jan 1, 1962
70.288
+0.312
0.45%
jan 1, 1963
70.494
+0.207
0.29%
jan 1, 1964
70.606
+0.111
0.16%
jan 1, 1965
70.636
+0.031
0.04%
jan 1, 1966
70.603
-0.033
-0.05%
jan 1, 1967
70.524
-0.079
-0.11%
jan 1, 1968
70.42
-0.105
-0.15%
jan 1, 1969
70.309
-0.11
-0.16%
jan 1, 1970
70.21
-0.099
-0.14%
jan 1, 1971
70.139
-0.071
-0.1%
jan 1, 1972
70.104
-0.034
-0.05%
jan 1, 1973
70.103
-0.001
0.0%
jan 1, 1974
70.128
+0.025
0.04%
jan 1, 1975
70.178
+0.05
0.07%
jan 1, 1976
70.247
+0.068
0.1%
jan 1, 1977
70.324
+0.077
0.11%
jan 1, 1978
70.4
+0.076
0.11%
jan 1, 1979
70.467
+0.067
0.1%
jan 1, 1980
70.521
+0.054
0.08%
jan 1, 1981
70.409
-0.112
-0.16%
jan 1, 1982
70.629
+0.221
0.31%
jan 1, 1983
70.689
+0.06
0.08%
jan 1, 1984
70.479
-0.21
-0.3%
jan 1, 1985
70.751
+0.272
0.39%
jan 1, 1986
70.735
-0.016
-0.02%
jan 1, 1987
71.021
+0.287
0.41%
jan 1, 1988
71.089
+0.068
0.1%
jan 1, 1989
71.208
+0.119
0.17%
jan 1, 1990
71.026
-0.181
-0.25%
jan 1, 1991
70.933
-0.094
-0.13%
jan 1, 1992
70.883
-0.05
-0.07%
jan 1, 1993
71.795
+0.912
1.29%
jan 1, 1994
72.449
+0.654
0.91%
jan 1, 1995
72.3
-0.149
-0.21%
jan 1, 1996
72.254
-0.046
-0.06%
jan 1, 1997
72.654
+0.4
0.55%
jan 1, 1998
72.705
+0.051
0.07%
jan 1, 1999
72.551
-0.154
-0.21%
jan 1, 2000
72.902
+0.351
0.48%
jan 1, 2001
73.051
+0.149
0.2%
jan 1, 2002
73.402
+0.351
0.48%
jan 1, 2003
73.605
+0.202
0.28%
jan 1, 2004
73.605
0.0
0.0%
jan 1, 2005
73.959
+0.354
0.48%
jan 1, 2006
73.905
-0.054
-0.07%
jan 1, 2007
74.205
+0.3
0.41%
jan 1, 2008
74.207
+0.002
0.0%
jan 1, 2009
74.705
+0.498
0.67%
jan 1, 2010
74.91
+0.205
0.27%
jan 1, 2011
75.112
+0.202
0.27%
jan 1, 2012
75.959
+0.846
1.13%
jan 1, 2013
76.11
+0.151
0.2%
jan 1, 2014
76.412
+0.302
0.4%
jan 1, 2015
76.715
+0.302
0.4%
Ranking of countries by current statistics by years


Comments: