29
/
en
AIzaSyAYiBZKx7MnpbEhh9jyipgxe19OcubqV5w
April 1, 2024
134935
French Polynesia
PYF
true
2
1
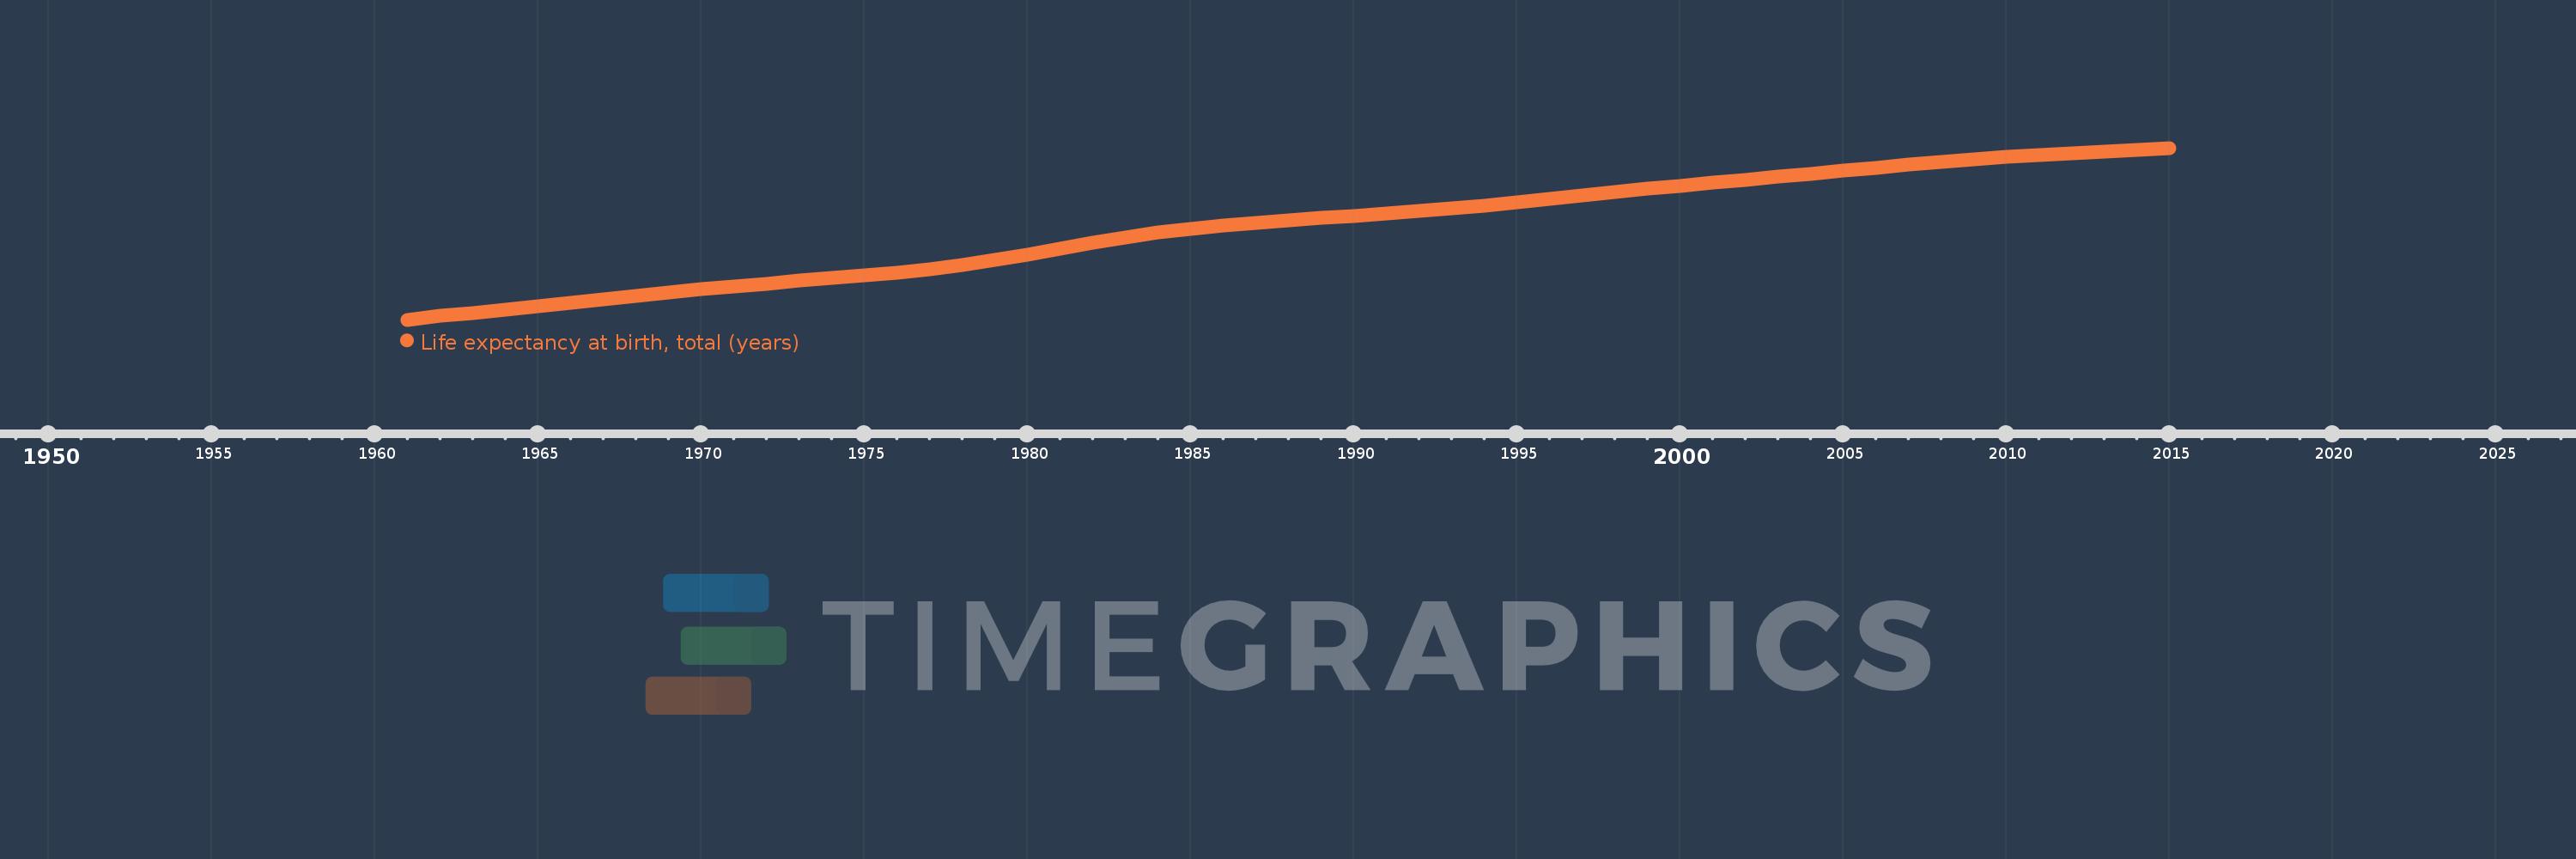
Life expectancy at birth, total (years)
2015,2014,2013,2012,2011,2010,2009,2008,2007,2006,2005,2004,2003,2002,2001,2000,1999,1998,1997,1996,1995,1994,1993,1992,1991,1990,1989,1988,1987,1986,1985,1984,1983,1982,1981,1980,1979,1978,1977,1976,1975,1974,1973,1972,1971,1970,1969,1968,1967,1966,1965,1964,1963,1962,1961
This statistics in other country:
AfghanistanAlbaniaAlgeriaAngolaAntigua and BarbudaArab WorldArgentinaArmeniaArubaAustraliaAustriaAzerbaijanBahamas, TheBahrainBangladeshBarbadosBelarusBelgiumBelizeBeninBermudaBhutanBoliviaBosnia and HerzegovinaBotswanaBrazilBrunei DarussalamBulgariaBurkina FasoBurundiCabo VerdeCambodiaCameroonCanadaCaribbean small statesCentral African RepublicCentral Europe and the BalticsChadChannel IslandsChileChinaColombiaComorosCongo, Dem. Rep.Congo, Rep.Costa RicaCote d'IvoireCroatiaCubaCuracaoCyprusCzech RepublicDenmarkDjiboutiDominicaDominican RepublicEarly-demographic dividendEast Asia & PacificEast Asia & Pacific (excluding high income)East Asia & Pacific (IDA & IBRD countries)EcuadorEgypt, Arab Rep.El SalvadorEquatorial GuineaEritreaEstoniaEthiopiaEuro areaEurope & Central AsiaEurope & Central Asia (excluding high income)Europe & Central Asia (IDA & IBRD countries)European UnionFaroe IslandsFijiFinlandFragile and conflict affected situationsFranceFrench PolynesiaGabonGambia, TheGeorgiaGermanyGhanaGreeceGreenlandGrenadaGuamGuatemalaGuineaGuinea-BissauGuyanaHaitiHeavily indebted poor countries (HIPC)High incomeHondurasHong Kong SAR, ChinaHungaryIBRD onlyIcelandIDA & IBRD totalIDA blendIDA onlyIDA totalIndiaIndonesiaIran, Islamic Rep.IraqIrelandIsle of ManIsraelItalyJamaicaJapanJordanKazakhstanKenyaKiribatiKorea, Dem. People’s Rep.Korea, Rep.KosovoKuwaitKyrgyz RepublicLao PDRLate-demographic dividendLatin America & Caribbean Latin America & Caribbean (excluding high income)Latin America & the Caribbean (IDA & IBRD countries)LatviaLeast developed countries: UN classificationLebanonLesothoLiberiaLibyaLiechtensteinLithuaniaLow & middle incomeLow incomeLower middle incomeLuxembourgMacao SAR, ChinaMacedonia, FYRMadagascarMalawiMalaysiaMaldivesMaliMaltaMarshall IslandsMauritaniaMauritiusMexicoMicronesia, Fed. Sts.Middle East & North AfricaMiddle East & North Africa (excluding high income)Middle East & North Africa (IDA & IBRD countries)Middle incomeMoldovaMongoliaMontenegroMoroccoMozambiqueMyanmarNamibiaNepalNetherlandsNew CaledoniaNew ZealandNicaraguaNigerNigeriaNorth AmericaNorwayOECD membersOmanOther small statesPacific island small statesPakistanPalauPanamaPapua New GuineaParaguayPeruPhilippinesPolandPortugalPost-demographic dividendPre-demographic dividendPuerto RicoQatarRomaniaRussian FederationRwandaSamoaSan MarinoSao Tome and PrincipeSaudi ArabiaSenegalSerbiaSeychellesSierra LeoneSingaporeSint Maarten (Dutch part)Slovak RepublicSloveniaSmall statesSolomon IslandsSomaliaSouth AfricaSouth AsiaSouth Asia (IDA & IBRD)South SudanSpainSri LankaSt. Kitts and NevisSt. LuciaSt. Martin (French part)St. Vincent and the GrenadinesSub-Saharan Africa Sub-Saharan Africa (excluding high income)Sub-Saharan Africa (IDA & IBRD countries)SudanSurinameSwazilandSwedenSwitzerlandSyrian Arab RepublicTajikistanTanzaniaThailandTimor-LesteTogoTongaTrinidad and TobagoTunisiaTurkeyTurkmenistanUgandaUkraineUnited Arab EmiratesUnited KingdomUnited StatesUpper middle incomeUruguayUzbekistanVanuatuVenezuela, RBVietnamVirgin Islands (U.S.)West Bank and GazaWorldYemen, Rep.ZambiaZimbabwe Timeline:
This timeline shows a graph from 1961 to 2015 of French Polynesia. No data until 1960. Number of actual observations by date: 55.
Source name:
World Development Indicators
Source organization:
Derived from male and female life expectancy at birth from sources such as: (1) United Nations Population Division. World Population Prospects, (2) Census reports and other statistical publications from national statistical offices, (3) Eurostat: Demographic Statistics, (4) United Nations Statistical Division. Population and Vital Statistics Reprot (various years), (5) U.S. Census Bureau: International Database, and (6) Secretariat of the Pacific Community: Statistics and Demography Programme.
Categories, topics:
Health
Last updated:
apr 23, 2017
Indicators value changes by year
Minimum:
56.357
jan 1, 1961
Maximum:
76.542
jan 1, 2015
At the date of observation
Value
Absolute change
Change from previous value
jan 1, 1961
56.357
+56.357
0.0%
jan 1, 1962
56.785
+0.428
0.76%
jan 1, 1963
57.171
+0.386
0.68%
jan 1, 1964
57.546
+0.375
0.66%
jan 1, 1965
57.93
+0.384
0.67%
jan 1, 1966
58.331
+0.401
0.69%
jan 1, 1967
58.746
+0.415
0.71%
jan 1, 1968
59.157
+0.411
0.7%
jan 1, 1969
59.549
+0.393
0.66%
jan 1, 1970
59.925
+0.376
0.63%
jan 1, 1971
60.28
+0.355
0.59%
jan 1, 1972
60.613
+0.333
0.55%
jan 1, 1973
60.929
+0.316
0.52%
jan 1, 1974
61.239
+0.31
0.51%
jan 1, 1975
61.557
+0.318
0.52%
jan 1, 1976
61.91
+0.353
0.57%
jan 1, 1977
62.329
+0.419
0.68%
jan 1, 1978
62.824
+0.495
0.79%
jan 1, 1979
63.396
+0.571
0.91%
jan 1, 1980
64.032
+0.637
1.0%
jan 1, 1981
64.706
+0.673
1.05%
jan 1, 1982
65.378
+0.672
1.04%
jan 1, 1983
66.009
+0.632
0.97%
jan 1, 1984
66.573
+0.563
0.85%
jan 1, 1985
67.055
+0.482
0.72%
jan 1, 1986
67.452
+0.397
0.59%
jan 1, 1987
67.774
+0.323
0.48%
jan 1, 1988
68.05
+0.276
0.41%
jan 1, 1989
68.307
+0.257
0.38%
jan 1, 1990
68.562
+0.254
0.37%
jan 1, 1991
68.829
+0.267
0.39%
jan 1, 1992
69.121
+0.292
0.42%
jan 1, 1993
69.44
+0.32
0.46%
jan 1, 1994
69.785
+0.344
0.5%
jan 1, 1995
70.155
+0.37
0.53%
jan 1, 1996
70.544
+0.389
0.55%
jan 1, 1997
70.943
+0.399
0.57%
jan 1, 1998
71.339
+0.396
0.56%
jan 1, 1999
71.724
+0.385
0.54%
jan 1, 2000
72.093
+0.37
0.52%
jan 1, 2001
72.45
+0.357
0.49%
jan 1, 2002
72.801
+0.351
0.48%
jan 1, 2003
73.153
+0.352
0.48%
jan 1, 2004
73.511
+0.358
0.49%
jan 1, 2005
73.87
+0.36
0.49%
jan 1, 2006
74.227
+0.356
0.48%
jan 1, 2007
74.57
+0.343
0.46%
jan 1, 2008
74.892
+0.322
0.43%
jan 1, 2009
75.187
+0.295
0.39%
jan 1, 2010
75.453
+0.267
0.35%
jan 1, 2011
75.695
+0.242
0.32%
jan 1, 2012
75.917
+0.222
0.29%
jan 1, 2013
76.127
+0.21
0.28%
jan 1, 2014
76.334
+0.207
0.27%
jan 1, 2015
76.542
+0.208
0.27%
Ranking of countries by current statistics by years


Comments: