29
/
en
AIzaSyAYiBZKx7MnpbEhh9jyipgxe19OcubqV5w
April 1, 2024
264827
Togo
TGO
true
2
1
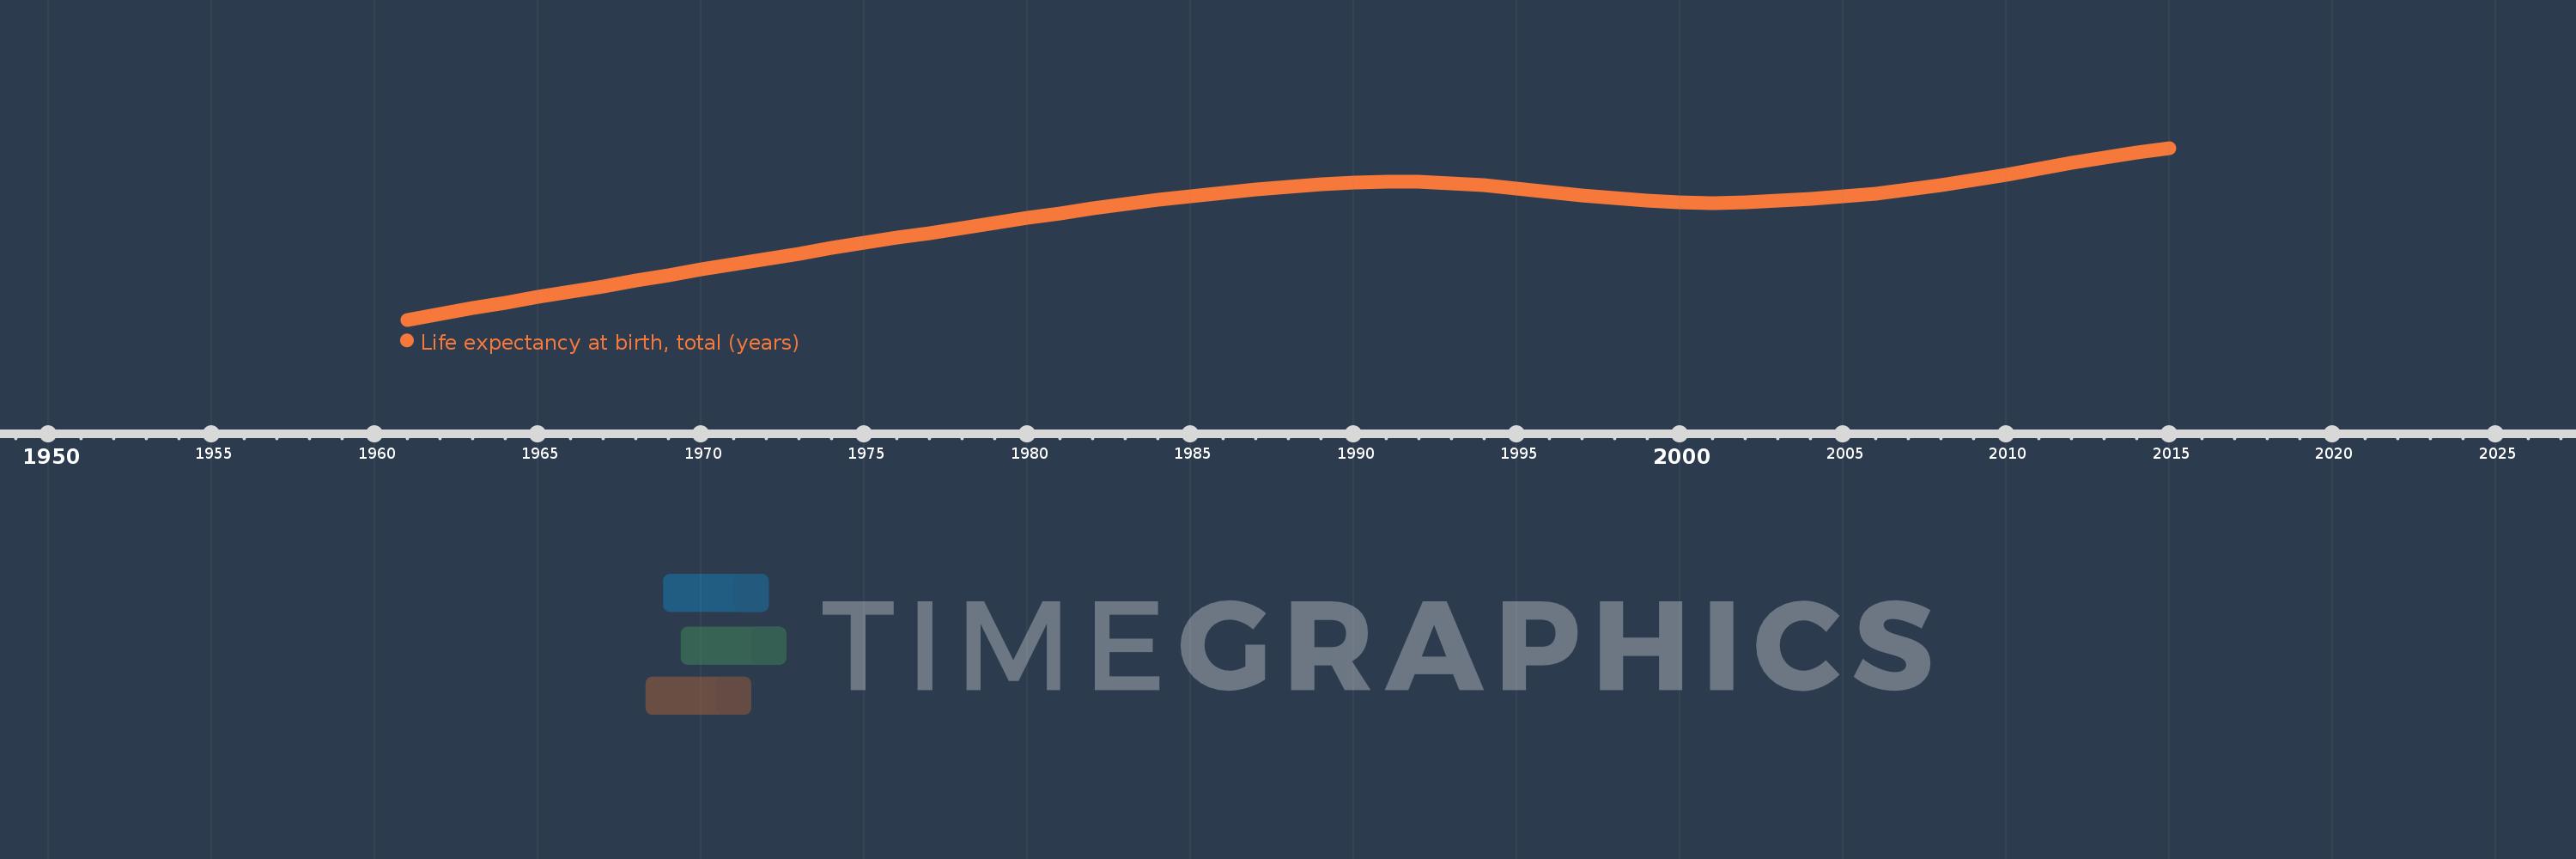
Life expectancy at birth, total (years)
2015,2014,2013,2012,2011,2010,2009,2008,2007,2006,2005,2004,2003,2002,2001,2000,1999,1998,1997,1996,1995,1994,1993,1992,1991,1990,1989,1988,1987,1986,1985,1984,1983,1982,1981,1980,1979,1978,1977,1976,1975,1974,1973,1972,1971,1970,1969,1968,1967,1966,1965,1964,1963,1962,1961
This statistics in other country:
AfghanistanAlbaniaAlgeriaAngolaAntigua and BarbudaArab WorldArgentinaArmeniaArubaAustraliaAustriaAzerbaijanBahamas, TheBahrainBangladeshBarbadosBelarusBelgiumBelizeBeninBermudaBhutanBoliviaBosnia and HerzegovinaBotswanaBrazilBrunei DarussalamBulgariaBurkina FasoBurundiCabo VerdeCambodiaCameroonCanadaCaribbean small statesCentral African RepublicCentral Europe and the BalticsChadChannel IslandsChileChinaColombiaComorosCongo, Dem. Rep.Congo, Rep.Costa RicaCote d'IvoireCroatiaCubaCuracaoCyprusCzech RepublicDenmarkDjiboutiDominicaDominican RepublicEarly-demographic dividendEast Asia & PacificEast Asia & Pacific (excluding high income)East Asia & Pacific (IDA & IBRD countries)EcuadorEgypt, Arab Rep.El SalvadorEquatorial GuineaEritreaEstoniaEthiopiaEuro areaEurope & Central AsiaEurope & Central Asia (excluding high income)Europe & Central Asia (IDA & IBRD countries)European UnionFaroe IslandsFijiFinlandFragile and conflict affected situationsFranceFrench PolynesiaGabonGambia, TheGeorgiaGermanyGhanaGreeceGreenlandGrenadaGuamGuatemalaGuineaGuinea-BissauGuyanaHaitiHeavily indebted poor countries (HIPC)High incomeHondurasHong Kong SAR, ChinaHungaryIBRD onlyIcelandIDA & IBRD totalIDA blendIDA onlyIDA totalIndiaIndonesiaIran, Islamic Rep.IraqIrelandIsle of ManIsraelItalyJamaicaJapanJordanKazakhstanKenyaKiribatiKorea, Dem. People’s Rep.Korea, Rep.KosovoKuwaitKyrgyz RepublicLao PDRLate-demographic dividendLatin America & Caribbean Latin America & Caribbean (excluding high income)Latin America & the Caribbean (IDA & IBRD countries)LatviaLeast developed countries: UN classificationLebanonLesothoLiberiaLibyaLiechtensteinLithuaniaLow & middle incomeLow incomeLower middle incomeLuxembourgMacao SAR, ChinaMacedonia, FYRMadagascarMalawiMalaysiaMaldivesMaliMaltaMarshall IslandsMauritaniaMauritiusMexicoMicronesia, Fed. Sts.Middle East & North AfricaMiddle East & North Africa (excluding high income)Middle East & North Africa (IDA & IBRD countries)Middle incomeMoldovaMongoliaMontenegroMoroccoMozambiqueMyanmarNamibiaNepalNetherlandsNew CaledoniaNew ZealandNicaraguaNigerNigeriaNorth AmericaNorwayOECD membersOmanOther small statesPacific island small statesPakistanPalauPanamaPapua New GuineaParaguayPeruPhilippinesPolandPortugalPost-demographic dividendPre-demographic dividendPuerto RicoQatarRomaniaRussian FederationRwandaSamoaSan MarinoSao Tome and PrincipeSaudi ArabiaSenegalSerbiaSeychellesSierra LeoneSingaporeSint Maarten (Dutch part)Slovak RepublicSloveniaSmall statesSolomon IslandsSomaliaSouth AfricaSouth AsiaSouth Asia (IDA & IBRD)South SudanSpainSri LankaSt. Kitts and NevisSt. LuciaSt. Martin (French part)St. Vincent and the GrenadinesSub-Saharan Africa Sub-Saharan Africa (excluding high income)Sub-Saharan Africa (IDA & IBRD countries)SudanSurinameSwazilandSwedenSwitzerlandSyrian Arab RepublicTajikistanTanzaniaThailandTimor-LesteTogoTongaTrinidad and TobagoTunisiaTurkeyTurkmenistanUgandaUkraineUnited Arab EmiratesUnited KingdomUnited StatesUpper middle incomeUruguayUzbekistanVanuatuVenezuela, RBVietnamVirgin Islands (U.S.)West Bank and GazaWorldYemen, Rep.ZambiaZimbabwe Timeline:
This timeline shows a graph from 1961 to 2015 of Togo. No data until 1960. Number of actual observations by date: 55.
Source name:
World Development Indicators
Source organization:
Derived from male and female life expectancy at birth from sources such as: (1) United Nations Population Division. World Population Prospects, (2) Census reports and other statistical publications from national statistical offices, (3) Eurostat: Demographic Statistics, (4) United Nations Statistical Division. Population and Vital Statistics Reprot (various years), (5) U.S. Census Bureau: International Database, and (6) Secretariat of the Pacific Community: Statistics and Demography Programme.
Categories, topics:
Health
Last updated:
apr 23, 2017
Indicators value changes by year
Minimum:
40.273
jan 1, 1961
Maximum:
59.656
jan 1, 2015
At the date of observation
Value
Absolute change
Change from previous value
jan 1, 1961
40.273
+40.273
0.0%
jan 1, 1962
40.916
+0.644
1.6%
jan 1, 1963
41.555
+0.639
1.56%
jan 1, 1964
42.189
+0.634
1.53%
jan 1, 1965
42.819
+0.63
1.49%
jan 1, 1966
43.445
+0.625
1.46%
jan 1, 1967
44.069
+0.624
1.44%
jan 1, 1968
44.689
+0.621
1.41%
jan 1, 1969
45.308
+0.619
1.38%
jan 1, 1970
45.923
+0.615
1.36%
jan 1, 1971
46.535
+0.612
1.33%
jan 1, 1972
47.142
+0.607
1.3%
jan 1, 1973
47.743
+0.601
1.27%
jan 1, 1974
48.337
+0.594
1.24%
jan 1, 1975
48.923
+0.586
1.21%
jan 1, 1976
49.502
+0.579
1.18%
jan 1, 1977
50.077
+0.575
1.16%
jan 1, 1978
50.648
+0.57
1.14%
jan 1, 1979
51.212
+0.564
1.11%
jan 1, 1980
51.765
+0.553
1.08%
jan 1, 1981
52.304
+0.54
1.04%
jan 1, 1982
52.828
+0.524
1.0%
jan 1, 1983
53.33
+0.501
0.95%
jan 1, 1984
53.802
+0.473
0.89%
jan 1, 1985
54.239
+0.437
0.81%
jan 1, 1986
54.635
+0.396
0.73%
jan 1, 1987
54.988
+0.353
0.65%
jan 1, 1988
55.296
+0.308
0.56%
jan 1, 1989
55.552
+0.255
0.46%
jan 1, 1990
55.744
+0.192
0.35%
jan 1, 1991
55.848
+0.104
0.19%
jan 1, 1992
55.835
-0.013
-0.02%
jan 1, 1993
55.698
-0.137
-0.25%
jan 1, 1994
55.45
-0.247
-0.44%
jan 1, 1995
55.113
-0.337
-0.61%
jan 1, 1996
54.725
-0.389
-0.71%
jan 1, 1997
54.33
-0.395
-0.72%
jan 1, 1998
53.973
-0.356
-0.66%
jan 1, 1999
53.696
-0.277
-0.51%
jan 1, 2000
53.524
-0.172
-0.32%
jan 1, 2001
53.469
-0.055
-0.1%
jan 1, 2002
53.527
+0.058
0.11%
jan 1, 2003
53.673
+0.147
0.27%
jan 1, 2004
53.887
+0.214
0.4%
jan 1, 2005
54.163
+0.276
0.51%
jan 1, 2006
54.508
+0.345
0.64%
jan 1, 2007
54.931
+0.423
0.78%
jan 1, 2008
55.433
+0.503
0.92%
jan 1, 2009
56.006
+0.572
1.03%
jan 1, 2010
56.631
+0.625
1.12%
jan 1, 2011
57.282
+0.651
1.15%
jan 1, 2012
57.931
+0.649
1.13%
jan 1, 2013
58.554
+0.623
1.08%
jan 1, 2014
59.132
+0.579
0.99%
jan 1, 2015
59.656
+0.523
0.89%
Ranking of countries by current statistics by years


Comments: