29
/
en
AIzaSyAYiBZKx7MnpbEhh9jyipgxe19OcubqV5w
April 1, 2024
180104
Libya
LBY
true
2
1
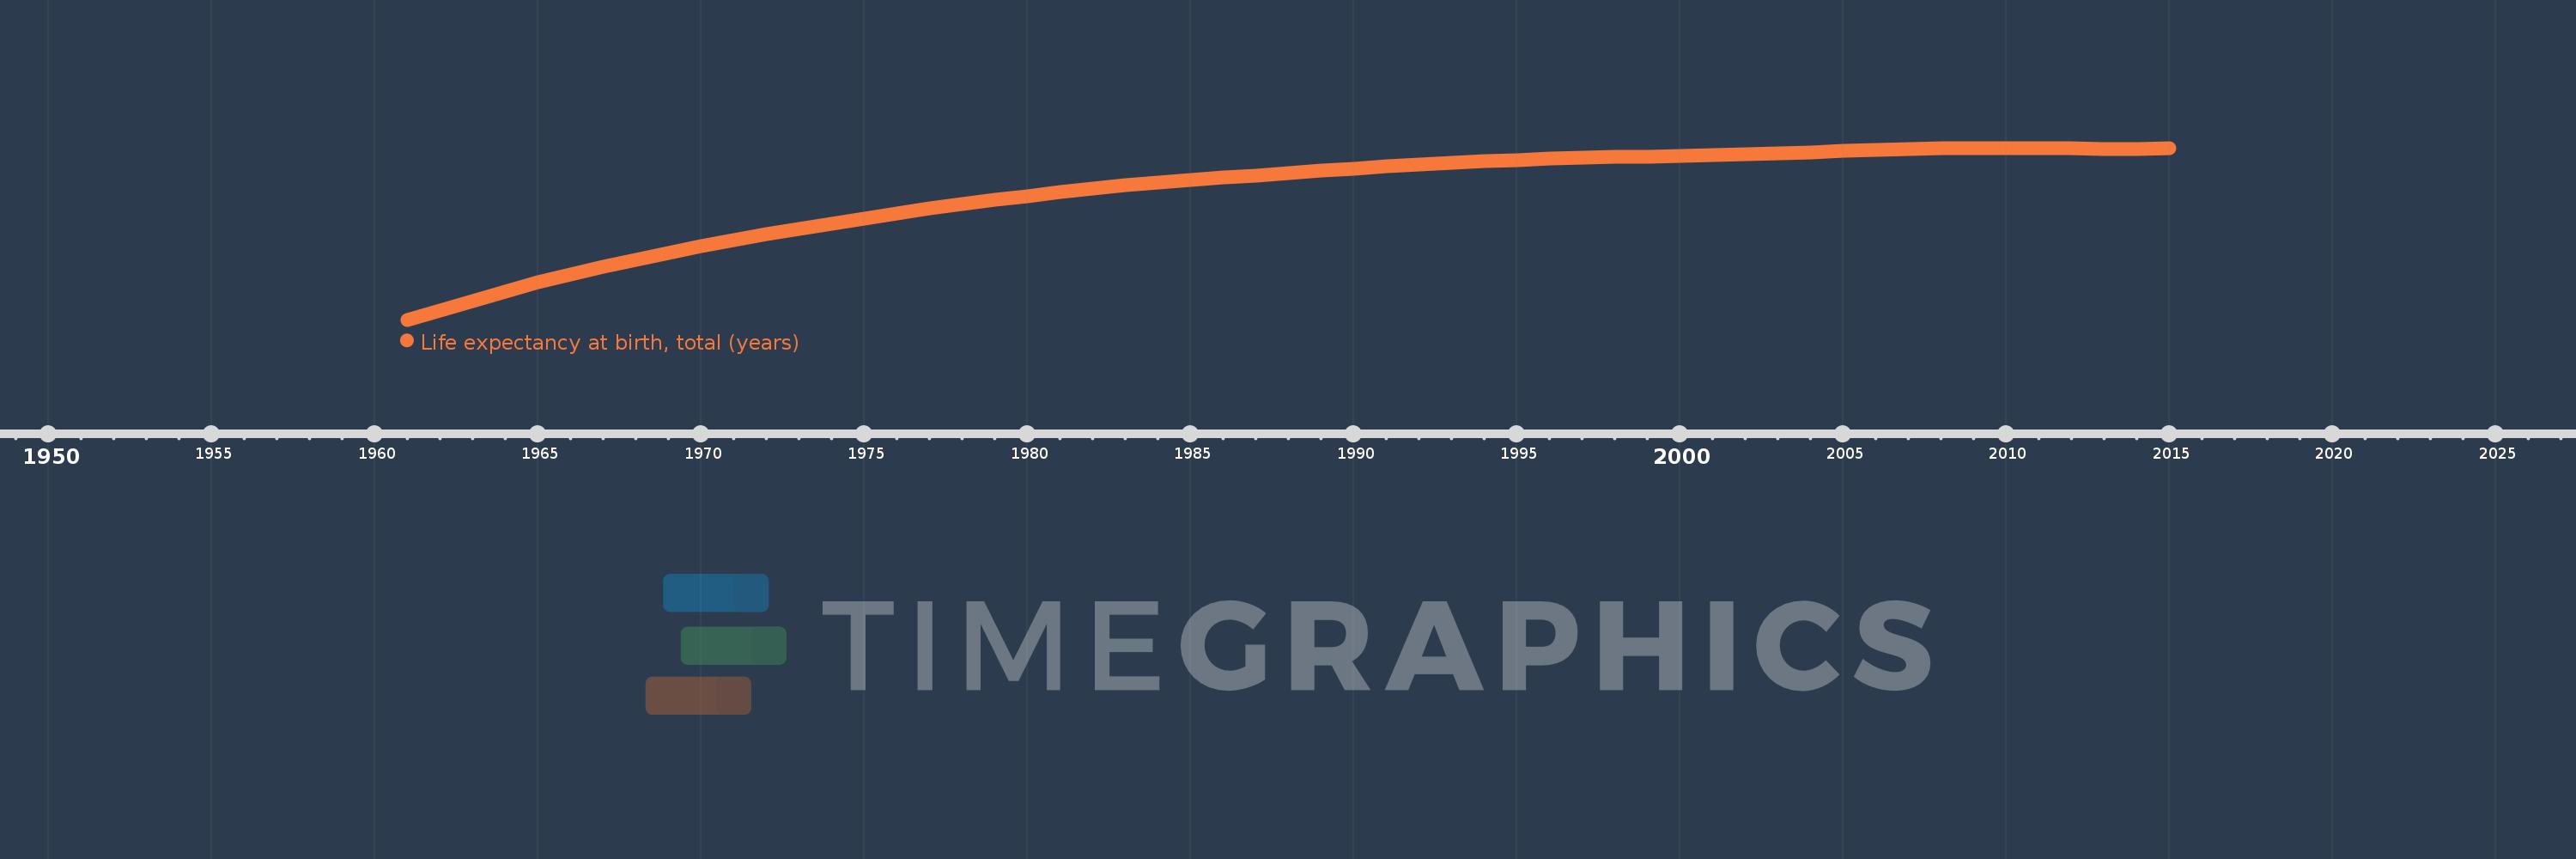
Life expectancy at birth, total (years)
2015,2014,2013,2012,2011,2010,2009,2008,2007,2006,2005,2004,2003,2002,2001,2000,1999,1998,1997,1996,1995,1994,1993,1992,1991,1990,1989,1988,1987,1986,1985,1984,1983,1982,1981,1980,1979,1978,1977,1976,1975,1974,1973,1972,1971,1970,1969,1968,1967,1966,1965,1964,1963,1962,1961
This statistics in other country:
AfghanistanAlbaniaAlgeriaAngolaAntigua and BarbudaArab WorldArgentinaArmeniaArubaAustraliaAustriaAzerbaijanBahamas, TheBahrainBangladeshBarbadosBelarusBelgiumBelizeBeninBermudaBhutanBoliviaBosnia and HerzegovinaBotswanaBrazilBrunei DarussalamBulgariaBurkina FasoBurundiCabo VerdeCambodiaCameroonCanadaCaribbean small statesCentral African RepublicCentral Europe and the BalticsChadChannel IslandsChileChinaColombiaComorosCongo, Dem. Rep.Congo, Rep.Costa RicaCote d'IvoireCroatiaCubaCuracaoCyprusCzech RepublicDenmarkDjiboutiDominicaDominican RepublicEarly-demographic dividendEast Asia & PacificEast Asia & Pacific (excluding high income)East Asia & Pacific (IDA & IBRD countries)EcuadorEgypt, Arab Rep.El SalvadorEquatorial GuineaEritreaEstoniaEthiopiaEuro areaEurope & Central AsiaEurope & Central Asia (excluding high income)Europe & Central Asia (IDA & IBRD countries)European UnionFaroe IslandsFijiFinlandFragile and conflict affected situationsFranceFrench PolynesiaGabonGambia, TheGeorgiaGermanyGhanaGreeceGreenlandGrenadaGuamGuatemalaGuineaGuinea-BissauGuyanaHaitiHeavily indebted poor countries (HIPC)High incomeHondurasHong Kong SAR, ChinaHungaryIBRD onlyIcelandIDA & IBRD totalIDA blendIDA onlyIDA totalIndiaIndonesiaIran, Islamic Rep.IraqIrelandIsle of ManIsraelItalyJamaicaJapanJordanKazakhstanKenyaKiribatiKorea, Dem. People’s Rep.Korea, Rep.KosovoKuwaitKyrgyz RepublicLao PDRLate-demographic dividendLatin America & Caribbean Latin America & Caribbean (excluding high income)Latin America & the Caribbean (IDA & IBRD countries)LatviaLeast developed countries: UN classificationLebanonLesothoLiberiaLibyaLiechtensteinLithuaniaLow & middle incomeLow incomeLower middle incomeLuxembourgMacao SAR, ChinaMacedonia, FYRMadagascarMalawiMalaysiaMaldivesMaliMaltaMarshall IslandsMauritaniaMauritiusMexicoMicronesia, Fed. Sts.Middle East & North AfricaMiddle East & North Africa (excluding high income)Middle East & North Africa (IDA & IBRD countries)Middle incomeMoldovaMongoliaMontenegroMoroccoMozambiqueMyanmarNamibiaNepalNetherlandsNew CaledoniaNew ZealandNicaraguaNigerNigeriaNorth AmericaNorwayOECD membersOmanOther small statesPacific island small statesPakistanPalauPanamaPapua New GuineaParaguayPeruPhilippinesPolandPortugalPost-demographic dividendPre-demographic dividendPuerto RicoQatarRomaniaRussian FederationRwandaSamoaSan MarinoSao Tome and PrincipeSaudi ArabiaSenegalSerbiaSeychellesSierra LeoneSingaporeSint Maarten (Dutch part)Slovak RepublicSloveniaSmall statesSolomon IslandsSomaliaSouth AfricaSouth AsiaSouth Asia (IDA & IBRD)South SudanSpainSri LankaSt. Kitts and NevisSt. LuciaSt. Martin (French part)St. Vincent and the GrenadinesSub-Saharan Africa Sub-Saharan Africa (excluding high income)Sub-Saharan Africa (IDA & IBRD countries)SudanSurinameSwazilandSwedenSwitzerlandSyrian Arab RepublicTajikistanTanzaniaThailandTimor-LesteTogoTongaTrinidad and TobagoTunisiaTurkeyTurkmenistanUgandaUkraineUnited Arab EmiratesUnited KingdomUnited StatesUpper middle incomeUruguayUzbekistanVanuatuVenezuela, RBVietnamVirgin Islands (U.S.)West Bank and GazaWorldYemen, Rep.ZambiaZimbabwe Timeline:
This timeline shows a graph from 1961 to 2015 of Libya. No data until 1960. Number of actual observations by date: 55.
Source name:
World Development Indicators
Source organization:
Derived from male and female life expectancy at birth from sources such as: (1) United Nations Population Division. World Population Prospects, (2) Census reports and other statistical publications from national statistical offices, (3) Eurostat: Demographic Statistics, (4) United Nations Statistical Division. Population and Vital Statistics Reprot (various years), (5) U.S. Census Bureau: International Database, and (6) Secretariat of the Pacific Community: Statistics and Demography Programme.
Categories, topics:
Health
Last updated:
apr 23, 2017
Indicators value changes by year
Minimum:
42.641
jan 1, 1961
Maximum:
71.787
jan 1, 2009
At the date of observation
Value
Absolute change
Change from previous value
jan 1, 1961
42.641
+42.641
0.0%
jan 1, 1962
44.247
+1.605
3.77%
jan 1, 1963
45.871
+1.625
3.67%
jan 1, 1964
47.456
+1.585
3.46%
jan 1, 1965
48.958
+1.501
3.16%
jan 1, 1966
50.35
+1.392
2.84%
jan 1, 1967
51.63
+1.28
2.54%
jan 1, 1968
52.831
+1.202
2.33%
jan 1, 1969
53.977
+1.146
2.17%
jan 1, 1970
55.072
+1.095
2.03%
jan 1, 1971
56.119
+1.046
1.9%
jan 1, 1972
57.118
+0.999
1.78%
jan 1, 1973
58.073
+0.955
1.67%
jan 1, 1974
58.985
+0.912
1.57%
jan 1, 1975
59.858
+0.872
1.48%
jan 1, 1976
60.691
+0.834
1.39%
jan 1, 1977
61.489
+0.797
1.31%
jan 1, 1978
62.248
+0.759
1.24%
jan 1, 1979
62.969
+0.72
1.16%
jan 1, 1980
63.649
+0.681
1.08%
jan 1, 1981
64.287
+0.637
1.0%
jan 1, 1982
64.874
+0.587
0.91%
jan 1, 1983
65.411
+0.536
0.83%
jan 1, 1984
65.898
+0.488
0.75%
jan 1, 1985
66.343
+0.444
0.67%
jan 1, 1986
66.754
+0.411
0.62%
jan 1, 1987
67.145
+0.39
0.58%
jan 1, 1988
67.524
+0.38
0.57%
jan 1, 1989
67.899
+0.374
0.55%
jan 1, 1990
68.27
+0.371
0.55%
jan 1, 1991
68.63
+0.36
0.53%
jan 1, 1992
68.969
+0.339
0.49%
jan 1, 1993
69.275
+0.306
0.44%
jan 1, 1994
69.541
+0.266
0.38%
jan 1, 1995
69.766
+0.225
0.32%
jan 1, 1996
69.951
+0.185
0.27%
jan 1, 1997
70.101
+0.15
0.21%
jan 1, 1998
70.228
+0.126
0.18%
jan 1, 1999
70.342
+0.114
0.16%
jan 1, 2000
70.452
+0.11
0.16%
jan 1, 2001
70.573
+0.121
0.17%
jan 1, 2002
70.717
+0.144
0.2%
jan 1, 2003
70.886
+0.169
0.24%
jan 1, 2004
71.074
+0.189
0.27%
jan 1, 2005
71.277
+0.202
0.28%
jan 1, 2006
71.471
+0.194
0.27%
jan 1, 2007
71.631
+0.16
0.22%
jan 1, 2008
71.739
+0.108
0.15%
jan 1, 2009
71.787
+0.049
0.07%
jan 1, 2010
71.781
-0.006
-0.01%
jan 1, 2011
71.737
-0.044
-0.06%
jan 1, 2012
71.683
-0.054
-0.08%
jan 1, 2013
71.65
-0.034
-0.05%
jan 1, 2014
71.658
+0.008
0.01%
jan 1, 2015
71.716
+0.058
0.08%
Ranking of countries by current statistics by years


Comments: