29
/
en
AIzaSyAYiBZKx7MnpbEhh9jyipgxe19OcubqV5w
April 1, 2024
179077
Liberia
LBR
true
2
1
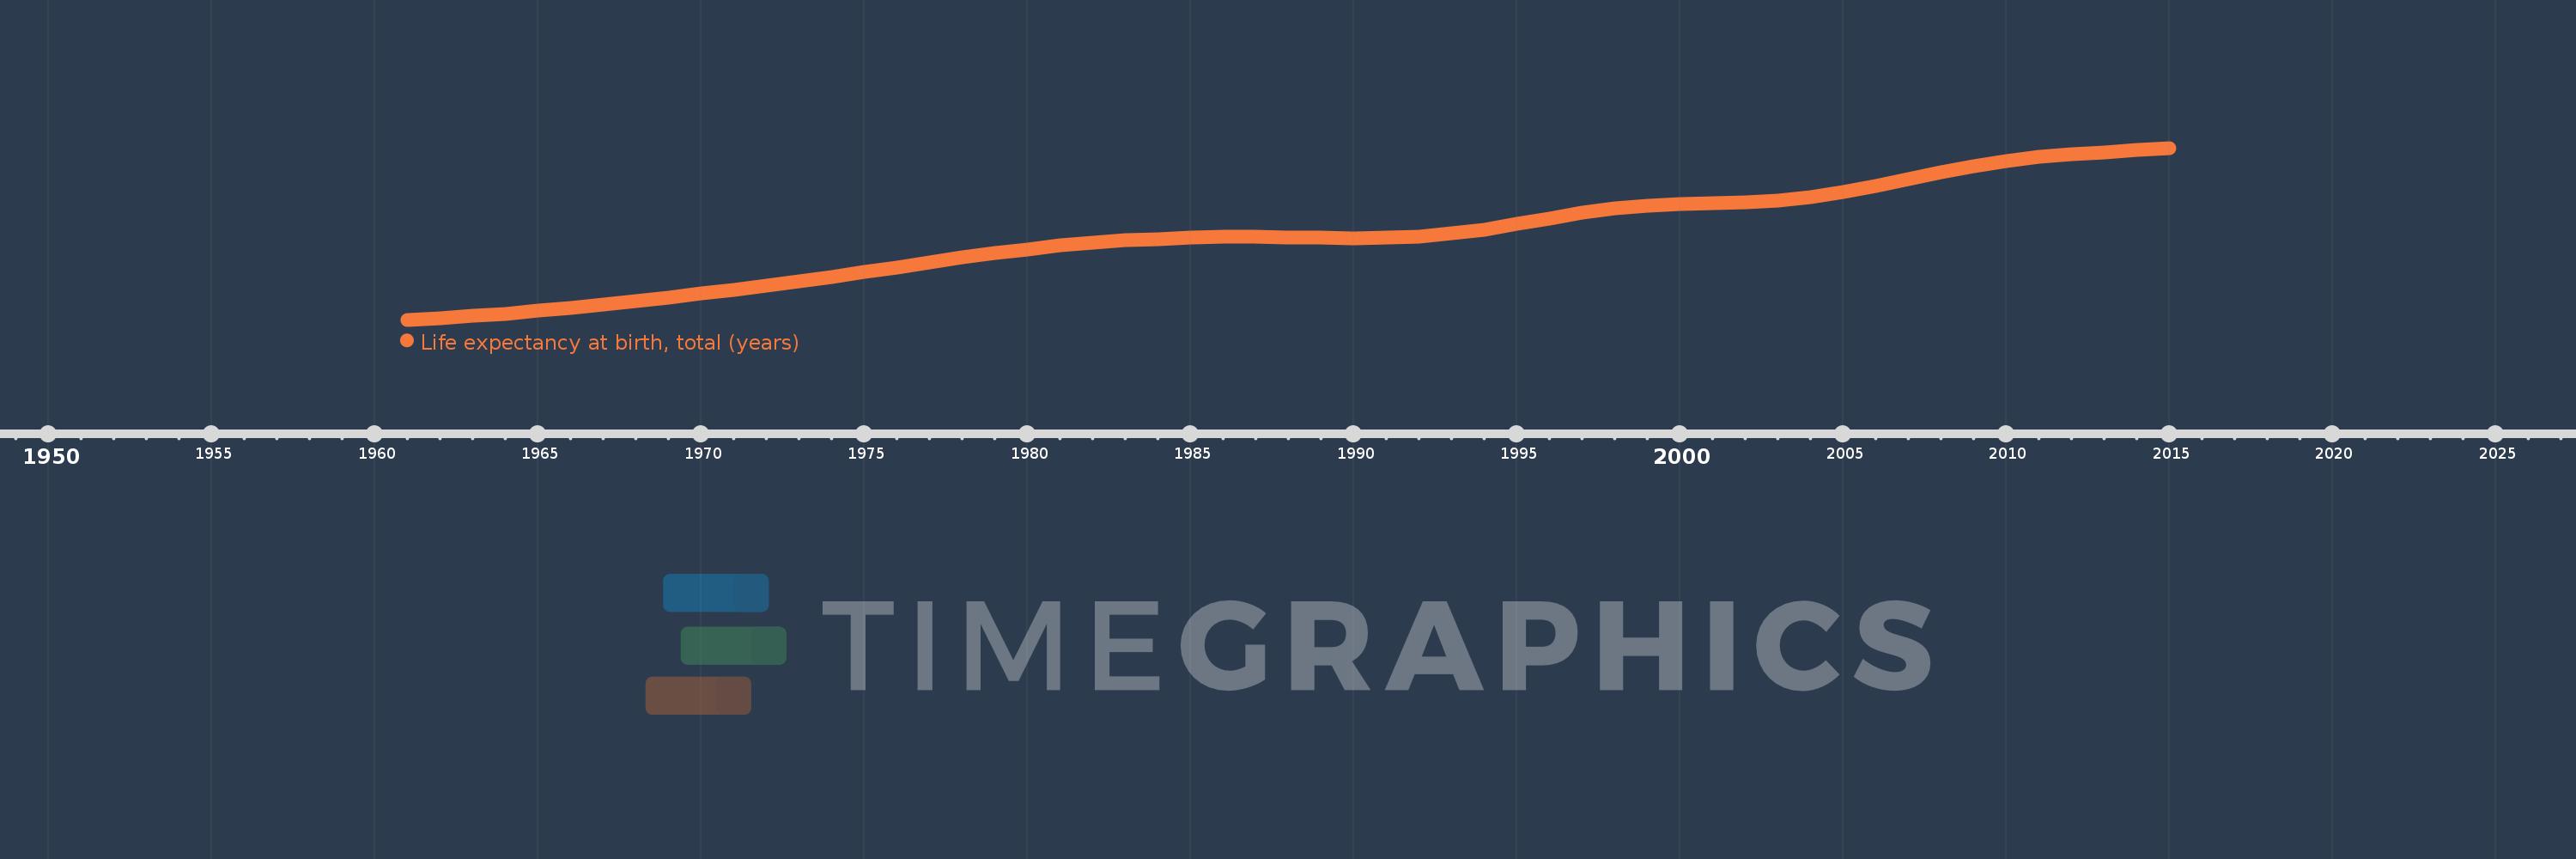
Life expectancy at birth, total (years)
2015,2014,2013,2012,2011,2010,2009,2008,2007,2006,2005,2004,2003,2002,2001,2000,1999,1998,1997,1996,1995,1994,1993,1992,1991,1990,1989,1988,1987,1986,1985,1984,1983,1982,1981,1980,1979,1978,1977,1976,1975,1974,1973,1972,1971,1970,1969,1968,1967,1966,1965,1964,1963,1962,1961
This statistics in other country:
AfghanistanAlbaniaAlgeriaAngolaAntigua and BarbudaArab WorldArgentinaArmeniaArubaAustraliaAustriaAzerbaijanBahamas, TheBahrainBangladeshBarbadosBelarusBelgiumBelizeBeninBermudaBhutanBoliviaBosnia and HerzegovinaBotswanaBrazilBrunei DarussalamBulgariaBurkina FasoBurundiCabo VerdeCambodiaCameroonCanadaCaribbean small statesCentral African RepublicCentral Europe and the BalticsChadChannel IslandsChileChinaColombiaComorosCongo, Dem. Rep.Congo, Rep.Costa RicaCote d'IvoireCroatiaCubaCuracaoCyprusCzech RepublicDenmarkDjiboutiDominicaDominican RepublicEarly-demographic dividendEast Asia & PacificEast Asia & Pacific (excluding high income)East Asia & Pacific (IDA & IBRD countries)EcuadorEgypt, Arab Rep.El SalvadorEquatorial GuineaEritreaEstoniaEthiopiaEuro areaEurope & Central AsiaEurope & Central Asia (excluding high income)Europe & Central Asia (IDA & IBRD countries)European UnionFaroe IslandsFijiFinlandFragile and conflict affected situationsFranceFrench PolynesiaGabonGambia, TheGeorgiaGermanyGhanaGreeceGreenlandGrenadaGuamGuatemalaGuineaGuinea-BissauGuyanaHaitiHeavily indebted poor countries (HIPC)High incomeHondurasHong Kong SAR, ChinaHungaryIBRD onlyIcelandIDA & IBRD totalIDA blendIDA onlyIDA totalIndiaIndonesiaIran, Islamic Rep.IraqIrelandIsle of ManIsraelItalyJamaicaJapanJordanKazakhstanKenyaKiribatiKorea, Dem. People’s Rep.Korea, Rep.KosovoKuwaitKyrgyz RepublicLao PDRLate-demographic dividendLatin America & Caribbean Latin America & Caribbean (excluding high income)Latin America & the Caribbean (IDA & IBRD countries)LatviaLeast developed countries: UN classificationLebanonLesothoLiberiaLibyaLiechtensteinLithuaniaLow & middle incomeLow incomeLower middle incomeLuxembourgMacao SAR, ChinaMacedonia, FYRMadagascarMalawiMalaysiaMaldivesMaliMaltaMarshall IslandsMauritaniaMauritiusMexicoMicronesia, Fed. Sts.Middle East & North AfricaMiddle East & North Africa (excluding high income)Middle East & North Africa (IDA & IBRD countries)Middle incomeMoldovaMongoliaMontenegroMoroccoMozambiqueMyanmarNamibiaNepalNetherlandsNew CaledoniaNew ZealandNicaraguaNigerNigeriaNorth AmericaNorwayOECD membersOmanOther small statesPacific island small statesPakistanPalauPanamaPapua New GuineaParaguayPeruPhilippinesPolandPortugalPost-demographic dividendPre-demographic dividendPuerto RicoQatarRomaniaRussian FederationRwandaSamoaSan MarinoSao Tome and PrincipeSaudi ArabiaSenegalSerbiaSeychellesSierra LeoneSingaporeSint Maarten (Dutch part)Slovak RepublicSloveniaSmall statesSolomon IslandsSomaliaSouth AfricaSouth AsiaSouth Asia (IDA & IBRD)South SudanSpainSri LankaSt. Kitts and NevisSt. LuciaSt. Martin (French part)St. Vincent and the GrenadinesSub-Saharan Africa Sub-Saharan Africa (excluding high income)Sub-Saharan Africa (IDA & IBRD countries)SudanSurinameSwazilandSwedenSwitzerlandSyrian Arab RepublicTajikistanTanzaniaThailandTimor-LesteTogoTongaTrinidad and TobagoTunisiaTurkeyTurkmenistanUgandaUkraineUnited Arab EmiratesUnited KingdomUnited StatesUpper middle incomeUruguayUzbekistanVanuatuVenezuela, RBVietnamVirgin Islands (U.S.)West Bank and GazaWorldYemen, Rep.ZambiaZimbabwe Timeline:
This timeline shows a graph from 1961 to 2015 of Liberia. No data until 1960. Number of actual observations by date: 55.
Source name:
World Development Indicators
Source organization:
Derived from male and female life expectancy at birth from sources such as: (1) United Nations Population Division. World Population Prospects, (2) Census reports and other statistical publications from national statistical offices, (3) Eurostat: Demographic Statistics, (4) United Nations Statistical Division. Population and Vital Statistics Reprot (various years), (5) U.S. Census Bureau: International Database, and (6) Secretariat of the Pacific Community: Statistics and Demography Programme.
Categories, topics:
Health
Last updated:
apr 23, 2017
Indicators value changes by year
Minimum:
34.783
jan 1, 1961
Maximum:
60.834
jan 1, 2015
At the date of observation
Value
Absolute change
Change from previous value
jan 1, 1961
34.783
+34.783
0.0%
jan 1, 1962
35.046
+0.263
0.76%
jan 1, 1963
35.354
+0.308
0.88%
jan 1, 1964
35.715
+0.361
1.02%
jan 1, 1965
36.13
+0.415
1.16%
jan 1, 1966
36.593
+0.463
1.28%
jan 1, 1967
37.096
+0.503
1.37%
jan 1, 1968
37.624
+0.528
1.42%
jan 1, 1969
38.168
+0.544
1.45%
jan 1, 1970
38.725
+0.557
1.46%
jan 1, 1971
39.302
+0.577
1.49%
jan 1, 1972
39.914
+0.611
1.56%
jan 1, 1973
40.566
+0.653
1.64%
jan 1, 1974
41.26
+0.694
1.71%
jan 1, 1975
41.984
+0.724
1.76%
jan 1, 1976
42.726
+0.741
1.77%
jan 1, 1977
43.468
+0.742
1.74%
jan 1, 1978
44.19
+0.722
1.66%
jan 1, 1979
44.869
+0.678
1.54%
jan 1, 1980
45.487
+0.618
1.38%
jan 1, 1981
46.022
+0.535
1.18%
jan 1, 1982
46.459
+0.437
0.95%
jan 1, 1983
46.8
+0.341
0.73%
jan 1, 1984
47.053
+0.253
0.54%
jan 1, 1985
47.227
+0.174
0.37%
jan 1, 1986
47.32
+0.093
0.2%
jan 1, 1987
47.331
+0.011
0.02%
jan 1, 1988
47.283
-0.048
-0.1%
jan 1, 1989
47.212
-0.071
-0.15%
jan 1, 1990
47.159
-0.052
-0.11%
jan 1, 1991
47.202
+0.043
0.09%
jan 1, 1992
47.423
+0.22
0.47%
jan 1, 1993
47.851
+0.429
0.9%
jan 1, 1994
48.484
+0.632
1.32%
jan 1, 1995
49.287
+0.803
1.66%
jan 1, 1996
50.163
+0.876
1.78%
jan 1, 1997
50.98
+0.817
1.63%
jan 1, 1998
51.633
+0.654
1.28%
jan 1, 1999
52.071
+0.437
0.85%
jan 1, 2000
52.301
+0.23
0.44%
jan 1, 2001
52.409
+0.108
0.21%
jan 1, 2002
52.533
+0.124
0.24%
jan 1, 2003
52.811
+0.277
0.53%
jan 1, 2004
53.329
+0.518
0.98%
jan 1, 2005
54.096
+0.768
1.44%
jan 1, 2006
55.066
+0.97
1.79%
jan 1, 2007
56.142
+1.076
1.95%
jan 1, 2008
57.191
+1.049
1.87%
jan 1, 2009
58.112
+0.921
1.61%
jan 1, 2010
58.866
+0.753
1.3%
jan 1, 2011
59.441
+0.576
0.98%
jan 1, 2012
59.864
+0.423
0.71%
jan 1, 2013
60.204
+0.34
0.57%
jan 1, 2014
60.52
+0.316
0.52%
jan 1, 2015
60.834
+0.314
0.52%
Ranking of countries by current statistics by years


Comments: