29
/
en
AIzaSyAYiBZKx7MnpbEhh9jyipgxe19OcubqV5w
April 1, 2024
185419
Madagascar
MDG
true
2
1
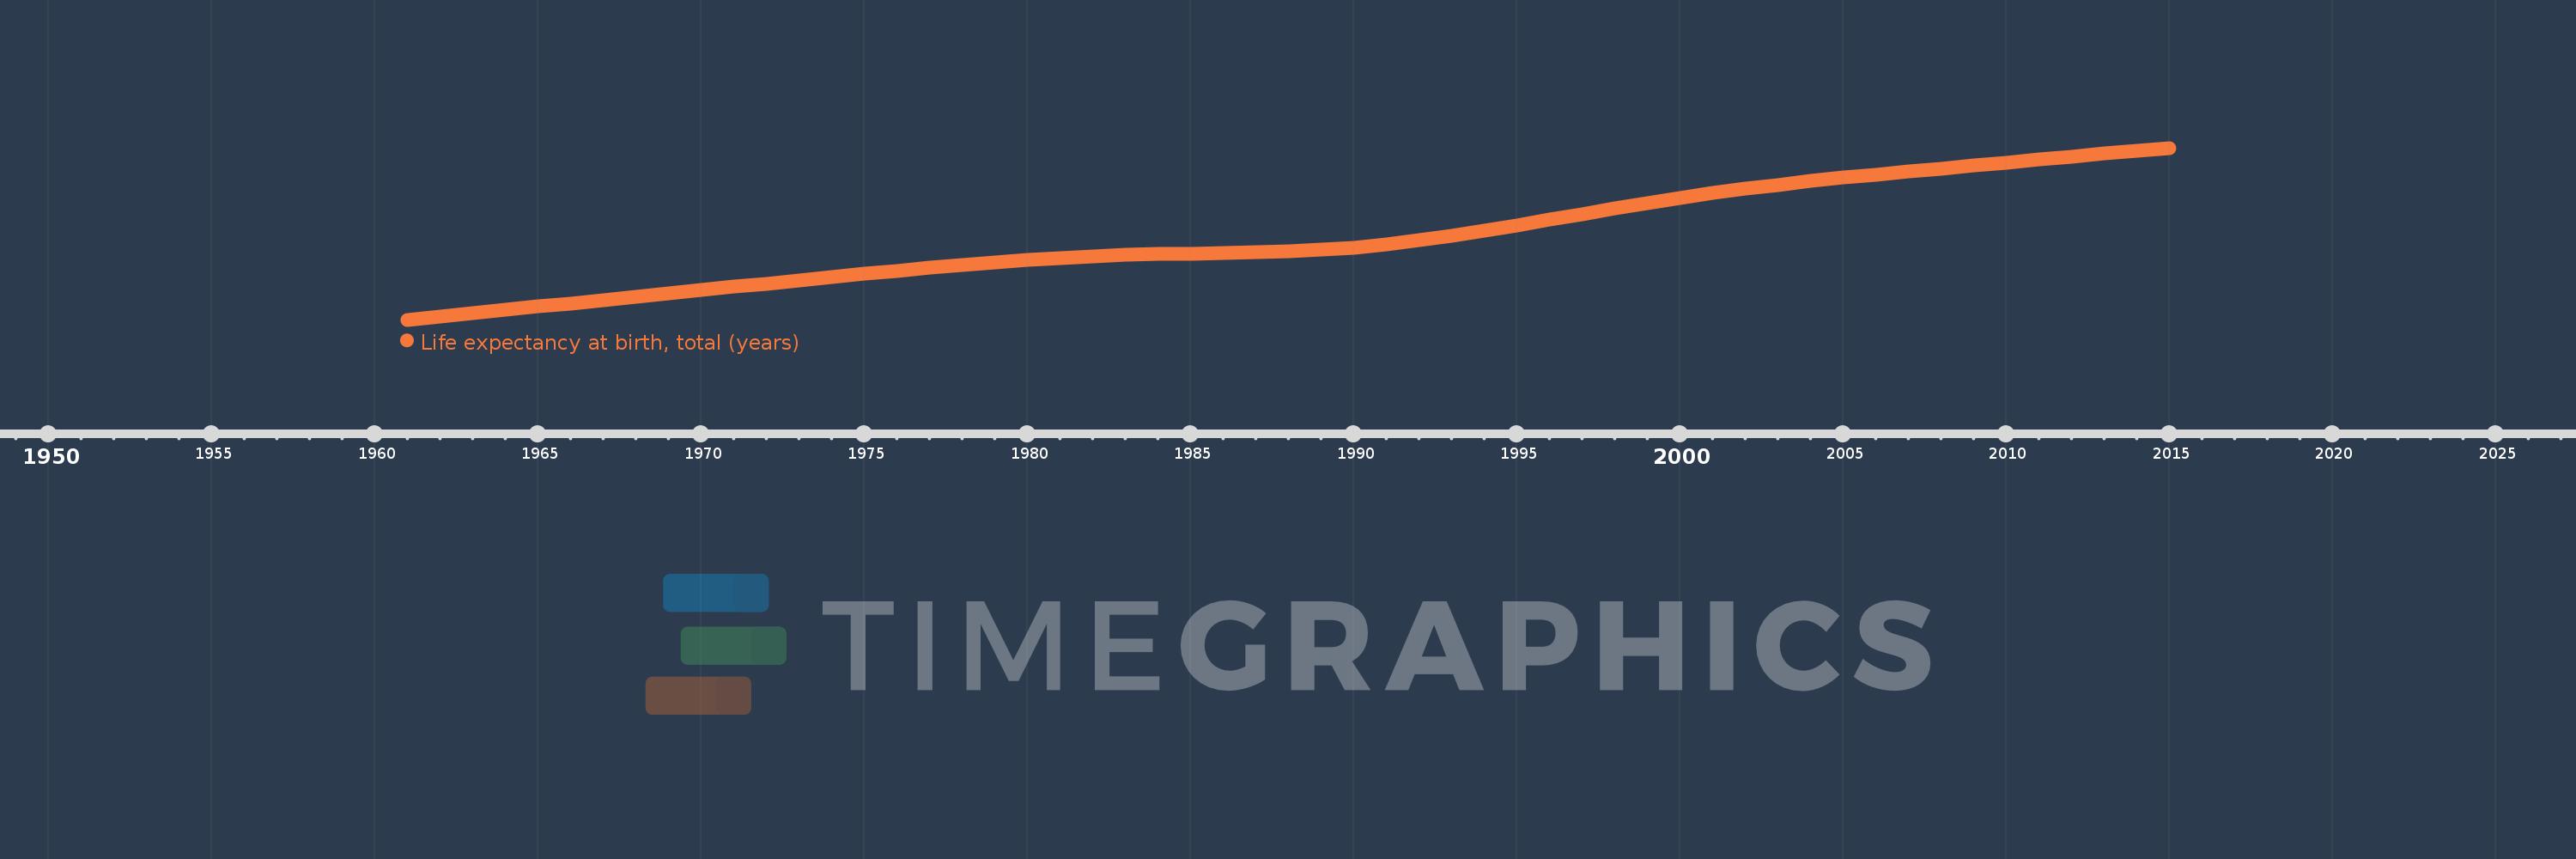
Life expectancy at birth, total (years)
2015,2014,2013,2012,2011,2010,2009,2008,2007,2006,2005,2004,2003,2002,2001,2000,1999,1998,1997,1996,1995,1994,1993,1992,1991,1990,1989,1988,1987,1986,1985,1984,1983,1982,1981,1980,1979,1978,1977,1976,1975,1974,1973,1972,1971,1970,1969,1968,1967,1966,1965,1964,1963,1962,1961
This statistics in other country:
AfghanistanAlbaniaAlgeriaAngolaAntigua and BarbudaArab WorldArgentinaArmeniaArubaAustraliaAustriaAzerbaijanBahamas, TheBahrainBangladeshBarbadosBelarusBelgiumBelizeBeninBermudaBhutanBoliviaBosnia and HerzegovinaBotswanaBrazilBrunei DarussalamBulgariaBurkina FasoBurundiCabo VerdeCambodiaCameroonCanadaCaribbean small statesCentral African RepublicCentral Europe and the BalticsChadChannel IslandsChileChinaColombiaComorosCongo, Dem. Rep.Congo, Rep.Costa RicaCote d'IvoireCroatiaCubaCuracaoCyprusCzech RepublicDenmarkDjiboutiDominicaDominican RepublicEarly-demographic dividendEast Asia & PacificEast Asia & Pacific (excluding high income)East Asia & Pacific (IDA & IBRD countries)EcuadorEgypt, Arab Rep.El SalvadorEquatorial GuineaEritreaEstoniaEthiopiaEuro areaEurope & Central AsiaEurope & Central Asia (excluding high income)Europe & Central Asia (IDA & IBRD countries)European UnionFaroe IslandsFijiFinlandFragile and conflict affected situationsFranceFrench PolynesiaGabonGambia, TheGeorgiaGermanyGhanaGreeceGreenlandGrenadaGuamGuatemalaGuineaGuinea-BissauGuyanaHaitiHeavily indebted poor countries (HIPC)High incomeHondurasHong Kong SAR, ChinaHungaryIBRD onlyIcelandIDA & IBRD totalIDA blendIDA onlyIDA totalIndiaIndonesiaIran, Islamic Rep.IraqIrelandIsle of ManIsraelItalyJamaicaJapanJordanKazakhstanKenyaKiribatiKorea, Dem. People’s Rep.Korea, Rep.KosovoKuwaitKyrgyz RepublicLao PDRLate-demographic dividendLatin America & Caribbean Latin America & Caribbean (excluding high income)Latin America & the Caribbean (IDA & IBRD countries)LatviaLeast developed countries: UN classificationLebanonLesothoLiberiaLibyaLiechtensteinLithuaniaLow & middle incomeLow incomeLower middle incomeLuxembourgMacao SAR, ChinaMacedonia, FYRMadagascarMalawiMalaysiaMaldivesMaliMaltaMarshall IslandsMauritaniaMauritiusMexicoMicronesia, Fed. Sts.Middle East & North AfricaMiddle East & North Africa (excluding high income)Middle East & North Africa (IDA & IBRD countries)Middle incomeMoldovaMongoliaMontenegroMoroccoMozambiqueMyanmarNamibiaNepalNetherlandsNew CaledoniaNew ZealandNicaraguaNigerNigeriaNorth AmericaNorwayOECD membersOmanOther small statesPacific island small statesPakistanPalauPanamaPapua New GuineaParaguayPeruPhilippinesPolandPortugalPost-demographic dividendPre-demographic dividendPuerto RicoQatarRomaniaRussian FederationRwandaSamoaSan MarinoSao Tome and PrincipeSaudi ArabiaSenegalSerbiaSeychellesSierra LeoneSingaporeSint Maarten (Dutch part)Slovak RepublicSloveniaSmall statesSolomon IslandsSomaliaSouth AfricaSouth AsiaSouth Asia (IDA & IBRD)South SudanSpainSri LankaSt. Kitts and NevisSt. LuciaSt. Martin (French part)St. Vincent and the GrenadinesSub-Saharan Africa Sub-Saharan Africa (excluding high income)Sub-Saharan Africa (IDA & IBRD countries)SudanSurinameSwazilandSwedenSwitzerlandSyrian Arab RepublicTajikistanTanzaniaThailandTimor-LesteTogoTongaTrinidad and TobagoTunisiaTurkeyTurkmenistanUgandaUkraineUnited Arab EmiratesUnited KingdomUnited StatesUpper middle incomeUruguayUzbekistanVanuatuVenezuela, RBVietnamVirgin Islands (U.S.)West Bank and GazaWorldYemen, Rep.ZambiaZimbabwe Timeline:
This timeline shows a graph from 1961 to 2015 of Madagascar. No data until 1960. Number of actual observations by date: 55.
Source name:
World Development Indicators
Source organization:
Derived from male and female life expectancy at birth from sources such as: (1) United Nations Population Division. World Population Prospects, (2) Census reports and other statistical publications from national statistical offices, (3) Eurostat: Demographic Statistics, (4) United Nations Statistical Division. Population and Vital Statistics Reprot (various years), (5) U.S. Census Bureau: International Database, and (6) Secretariat of the Pacific Community: Statistics and Demography Programme.
Categories, topics:
Health
Last updated:
apr 23, 2017
Indicators value changes by year
Minimum:
39.975
jan 1, 1961
Maximum:
65.086
jan 1, 2015
At the date of observation
Value
Absolute change
Change from previous value
jan 1, 1961
39.975
+39.975
0.0%
jan 1, 1962
40.457
+0.483
1.21%
jan 1, 1963
40.938
+0.481
1.19%
jan 1, 1964
41.415
+0.477
1.17%
jan 1, 1965
41.891
+0.476
1.15%
jan 1, 1966
42.366
+0.475
1.13%
jan 1, 1967
42.843
+0.477
1.13%
jan 1, 1968
43.324
+0.481
1.12%
jan 1, 1969
43.809
+0.485
1.12%
jan 1, 1970
44.295
+0.487
1.11%
jan 1, 1971
44.782
+0.487
1.1%
jan 1, 1972
45.267
+0.485
1.08%
jan 1, 1973
45.747
+0.479
1.06%
jan 1, 1974
46.216
+0.469
1.03%
jan 1, 1975
46.672
+0.455
0.99%
jan 1, 1976
47.111
+0.44
0.94%
jan 1, 1977
47.538
+0.426
0.91%
jan 1, 1978
47.95
+0.412
0.87%
jan 1, 1979
48.341
+0.392
0.82%
jan 1, 1980
48.709
+0.368
0.76%
jan 1, 1981
49.031
+0.322
0.66%
jan 1, 1982
49.285
+0.254
0.52%
jan 1, 1983
49.466
+0.181
0.37%
jan 1, 1984
49.581
+0.116
0.23%
jan 1, 1985
49.652
+0.071
0.14%
jan 1, 1986
49.71
+0.058
0.12%
jan 1, 1987
49.795
+0.085
0.17%
jan 1, 1988
49.943
+0.148
0.3%
jan 1, 1989
50.185
+0.242
0.48%
jan 1, 1990
50.536
+0.351
0.7%
jan 1, 1991
51.008
+0.472
0.93%
jan 1, 1992
51.598
+0.59
1.16%
jan 1, 1993
52.28
+0.682
1.32%
jan 1, 1994
53.023
+0.743
1.42%
jan 1, 1995
53.807
+0.784
1.48%
jan 1, 1996
54.614
+0.807
1.5%
jan 1, 1997
55.427
+0.813
1.49%
jan 1, 1998
56.234
+0.807
1.46%
jan 1, 1999
57.02
+0.787
1.4%
jan 1, 2000
57.772
+0.751
1.32%
jan 1, 2001
58.473
+0.701
1.21%
jan 1, 2002
59.114
+0.641
1.1%
jan 1, 2003
59.699
+0.586
0.99%
jan 1, 2004
60.236
+0.536
0.9%
jan 1, 2005
60.729
+0.493
0.82%
jan 1, 2006
61.187
+0.459
0.76%
jan 1, 2007
61.624
+0.437
0.71%
jan 1, 2008
62.053
+0.429
0.7%
jan 1, 2009
62.483
+0.43
0.69%
jan 1, 2010
62.918
+0.435
0.7%
jan 1, 2011
63.362
+0.444
0.7%
jan 1, 2012
63.807
+0.446
0.7%
jan 1, 2013
64.247
+0.439
0.69%
jan 1, 2014
64.674
+0.427
0.67%
jan 1, 2015
65.086
+0.412
0.64%
Ranking of countries by current statistics by years


Comments: