29
/
en
AIzaSyAYiBZKx7MnpbEhh9jyipgxe19OcubqV5w
April 1, 2024
102639
Central African Republic
CAF
true
2
1
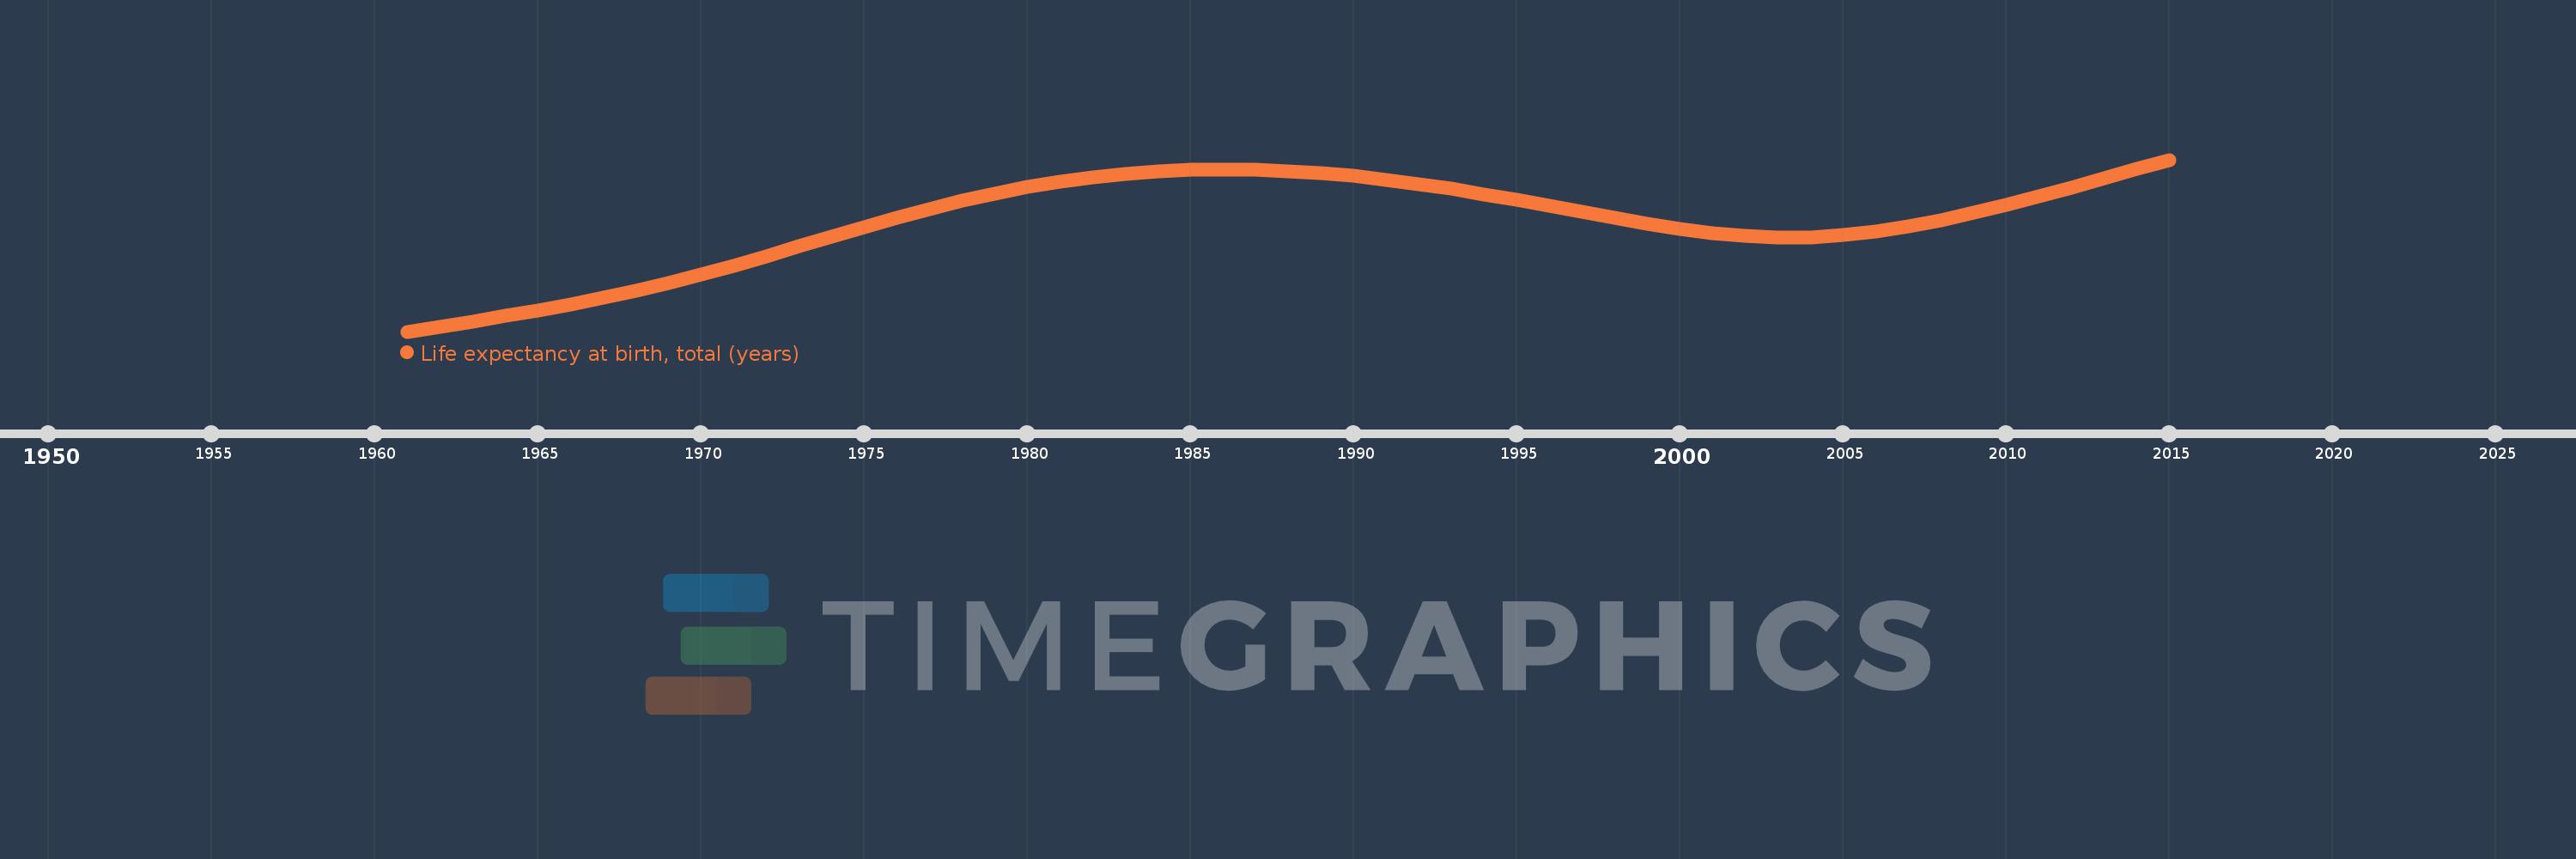
Life expectancy at birth, total (years)
2015,2014,2013,2012,2011,2010,2009,2008,2007,2006,2005,2004,2003,2002,2001,2000,1999,1998,1997,1996,1995,1994,1993,1992,1991,1990,1989,1988,1987,1986,1985,1984,1983,1982,1981,1980,1979,1978,1977,1976,1975,1974,1973,1972,1971,1970,1969,1968,1967,1966,1965,1964,1963,1962,1961
This statistics in other country:
AfghanistanAlbaniaAlgeriaAngolaAntigua and BarbudaArab WorldArgentinaArmeniaArubaAustraliaAustriaAzerbaijanBahamas, TheBahrainBangladeshBarbadosBelarusBelgiumBelizeBeninBermudaBhutanBoliviaBosnia and HerzegovinaBotswanaBrazilBrunei DarussalamBulgariaBurkina FasoBurundiCabo VerdeCambodiaCameroonCanadaCaribbean small statesCentral African RepublicCentral Europe and the BalticsChadChannel IslandsChileChinaColombiaComorosCongo, Dem. Rep.Congo, Rep.Costa RicaCote d'IvoireCroatiaCubaCuracaoCyprusCzech RepublicDenmarkDjiboutiDominicaDominican RepublicEarly-demographic dividendEast Asia & PacificEast Asia & Pacific (excluding high income)East Asia & Pacific (IDA & IBRD countries)EcuadorEgypt, Arab Rep.El SalvadorEquatorial GuineaEritreaEstoniaEthiopiaEuro areaEurope & Central AsiaEurope & Central Asia (excluding high income)Europe & Central Asia (IDA & IBRD countries)European UnionFaroe IslandsFijiFinlandFragile and conflict affected situationsFranceFrench PolynesiaGabonGambia, TheGeorgiaGermanyGhanaGreeceGreenlandGrenadaGuamGuatemalaGuineaGuinea-BissauGuyanaHaitiHeavily indebted poor countries (HIPC)High incomeHondurasHong Kong SAR, ChinaHungaryIBRD onlyIcelandIDA & IBRD totalIDA blendIDA onlyIDA totalIndiaIndonesiaIran, Islamic Rep.IraqIrelandIsle of ManIsraelItalyJamaicaJapanJordanKazakhstanKenyaKiribatiKorea, Dem. People’s Rep.Korea, Rep.KosovoKuwaitKyrgyz RepublicLao PDRLate-demographic dividendLatin America & Caribbean Latin America & Caribbean (excluding high income)Latin America & the Caribbean (IDA & IBRD countries)LatviaLeast developed countries: UN classificationLebanonLesothoLiberiaLibyaLiechtensteinLithuaniaLow & middle incomeLow incomeLower middle incomeLuxembourgMacao SAR, ChinaMacedonia, FYRMadagascarMalawiMalaysiaMaldivesMaliMaltaMarshall IslandsMauritaniaMauritiusMexicoMicronesia, Fed. Sts.Middle East & North AfricaMiddle East & North Africa (excluding high income)Middle East & North Africa (IDA & IBRD countries)Middle incomeMoldovaMongoliaMontenegroMoroccoMozambiqueMyanmarNamibiaNepalNetherlandsNew CaledoniaNew ZealandNicaraguaNigerNigeriaNorth AmericaNorwayOECD membersOmanOther small statesPacific island small statesPakistanPalauPanamaPapua New GuineaParaguayPeruPhilippinesPolandPortugalPost-demographic dividendPre-demographic dividendPuerto RicoQatarRomaniaRussian FederationRwandaSamoaSan MarinoSao Tome and PrincipeSaudi ArabiaSenegalSerbiaSeychellesSierra LeoneSingaporeSint Maarten (Dutch part)Slovak RepublicSloveniaSmall statesSolomon IslandsSomaliaSouth AfricaSouth AsiaSouth Asia (IDA & IBRD)South SudanSpainSri LankaSt. Kitts and NevisSt. LuciaSt. Martin (French part)St. Vincent and the GrenadinesSub-Saharan Africa Sub-Saharan Africa (excluding high income)Sub-Saharan Africa (IDA & IBRD countries)SudanSurinameSwazilandSwedenSwitzerlandSyrian Arab RepublicTajikistanTanzaniaThailandTimor-LesteTogoTongaTrinidad and TobagoTunisiaTurkeyTurkmenistanUgandaUkraineUnited Arab EmiratesUnited KingdomUnited StatesUpper middle incomeUruguayUzbekistanVanuatuVenezuela, RBVietnamVirgin Islands (U.S.)West Bank and GazaWorldYemen, Rep.ZambiaZimbabwe Timeline:
This timeline shows a graph from 1961 to 2015 of Central African Republic. No data until 1960. Number of actual observations by date: 55.
Source name:
World Development Indicators
Source organization:
Derived from male and female life expectancy at birth from sources such as: (1) United Nations Population Division. World Population Prospects, (2) Census reports and other statistical publications from national statistical offices, (3) Eurostat: Demographic Statistics, (4) United Nations Statistical Division. Population and Vital Statistics Reprot (various years), (5) U.S. Census Bureau: International Database, and (6) Secretariat of the Pacific Community: Statistics and Demography Programme.
Categories, topics:
Health
Last updated:
apr 23, 2017
Indicators value changes by year
Minimum:
36.483
jan 1, 1961
Maximum:
50.658
jan 1, 2015
At the date of observation
Value
Absolute change
Change from previous value
jan 1, 1961
36.483
+36.483
0.0%
jan 1, 1962
36.896
+0.413
1.13%
jan 1, 1963
37.319
+0.423
1.15%
jan 1, 1964
37.76
+0.442
1.18%
jan 1, 1965
38.225
+0.465
1.23%
jan 1, 1966
38.726
+0.5
1.31%
jan 1, 1967
39.273
+0.547
1.41%
jan 1, 1968
39.869
+0.596
1.52%
jan 1, 1969
40.513
+0.644
1.62%
jan 1, 1970
41.202
+0.69
1.7%
jan 1, 1971
41.935
+0.733
1.78%
jan 1, 1972
42.708
+0.773
1.84%
jan 1, 1973
43.508
+0.8
1.87%
jan 1, 1974
44.315
+0.807
1.85%
jan 1, 1975
45.112
+0.797
1.8%
jan 1, 1976
45.881
+0.77
1.71%
jan 1, 1977
46.608
+0.727
1.58%
jan 1, 1978
47.281
+0.673
1.44%
jan 1, 1979
47.891
+0.61
1.29%
jan 1, 1980
48.424
+0.533
1.11%
jan 1, 1981
48.873
+0.448
0.93%
jan 1, 1982
49.232
+0.359
0.74%
jan 1, 1983
49.508
+0.276
0.56%
jan 1, 1984
49.706
+0.198
0.4%
jan 1, 1985
49.826
+0.12
0.24%
jan 1, 1986
49.868
+0.043
0.09%
jan 1, 1987
49.833
-0.036
-0.07%
jan 1, 1988
49.724
-0.108
-0.22%
jan 1, 1989
49.548
-0.176
-0.35%
jan 1, 1990
49.312
-0.236
-0.48%
jan 1, 1991
49.018
-0.295
-0.6%
jan 1, 1992
48.664
-0.353
-0.72%
jan 1, 1993
48.257
-0.407
-0.84%
jan 1, 1994
47.81
-0.447
-0.93%
jan 1, 1995
47.336
-0.474
-0.99%
jan 1, 1996
46.846
-0.49
-1.04%
jan 1, 1997
46.345
-0.501
-1.07%
jan 1, 1998
45.846
-0.499
-1.08%
jan 1, 1999
45.37
-0.476
-1.04%
jan 1, 2000
44.943
-0.427
-0.94%
jan 1, 2001
44.597
-0.346
-0.77%
jan 1, 2002
44.362
-0.235
-0.53%
jan 1, 2003
44.253
-0.109
-0.24%
jan 1, 2004
44.278
+0.024
0.06%
jan 1, 2005
44.44
+0.162
0.37%
jan 1, 2006
44.738
+0.298
0.67%
jan 1, 2007
45.163
+0.425
0.95%
jan 1, 2008
45.687
+0.524
1.16%
jan 1, 2009
46.284
+0.597
1.31%
jan 1, 2010
46.935
+0.651
1.41%
jan 1, 2011
47.625
+0.69
1.47%
jan 1, 2012
48.35
+0.725
1.52%
jan 1, 2013
49.105
+0.755
1.56%
jan 1, 2014
49.88
+0.775
1.58%
jan 1, 2015
50.658
+0.778
1.56%
Ranking of countries by current statistics by years


Comments: