29
/
en
AIzaSyAYiBZKx7MnpbEhh9jyipgxe19OcubqV5w
April 1, 2024
68916
Antigua and Barbuda
ATG
true
2
1
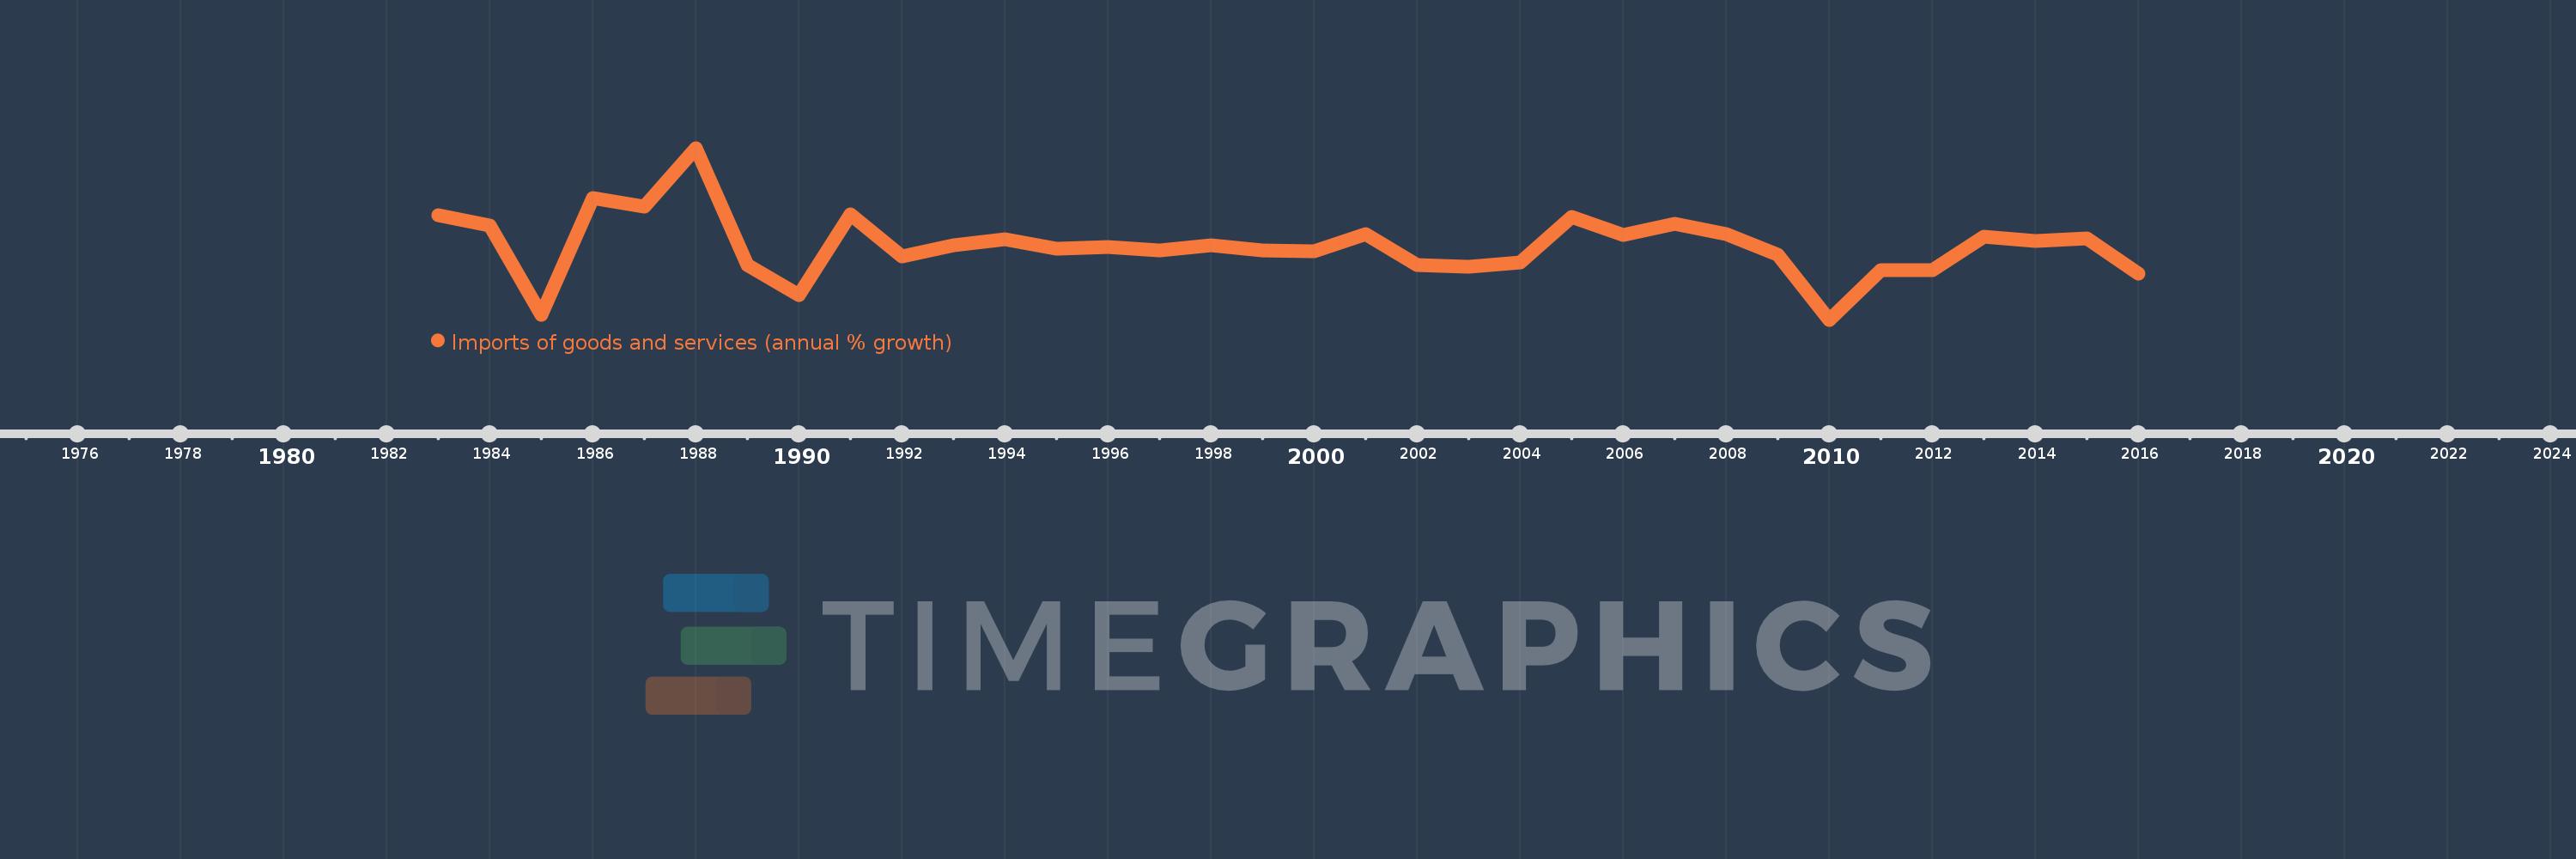
Imports of goods and services (annual % growth)
2016,2015,2014,2013,2012,2011,2010,2009,2008,2007,2006,2005,2004,2003,2002,2001,2000,1999,1998,1997,1996,1995,1994,1993,1992,1991,1990,1989,1988,1987,1986,1985,1984,1983
This statistics in other country:
AlbaniaAlgeriaAngolaAntigua and BarbudaArab WorldArgentinaArmeniaAustraliaAustriaAzerbaijanBahamas, TheBahrainBangladeshBarbadosBelarusBelgiumBelizeBeninBhutanBoliviaBosnia and HerzegovinaBotswanaBrazilBrunei DarussalamBulgariaBurkina FasoBurundiCabo VerdeCambodiaCameroonCanadaCaribbean small statesCentral Europe and the BalticsChadChileColombiaComorosCongo, Dem. Rep.Congo, Rep.Costa RicaCote d'IvoireCroatiaCubaCyprusCzech RepublicDenmarkDjiboutiDominican RepublicEarly-demographic dividendEast Asia & PacificEcuadorEgypt, Arab Rep.El SalvadorEquatorial GuineaEritreaEstoniaEthiopiaEuro areaEurope & Central AsiaEurope & Central Asia (excluding high income)Europe & Central Asia (IDA & IBRD countries)European UnionFijiFinlandFranceGabonGambia, TheGeorgiaGermanyGhanaGreeceGuatemalaGuineaGuinea-BissauHaitiHeavily indebted poor countries (HIPC)High incomeHondurasHong Kong SAR, ChinaHungaryIBRD onlyIcelandIDA & IBRD totalIDA blendIDA onlyIDA totalIndiaIndonesiaIran, Islamic Rep.IrelandIsraelItalyJamaicaJapanJordanKazakhstanKenyaKorea, Rep.KosovoKuwaitKyrgyz RepublicLao PDRLatin America & Caribbean Latin America & Caribbean (excluding high income)Latin America & the Caribbean (IDA & IBRD countries)LatviaLeast developed countries: UN classificationLebanonLiberiaLibyaLithuaniaLow & middle incomeLow incomeLower middle incomeLuxembourgMacao SAR, ChinaMacedonia, FYRMadagascarMalawiMalaysiaMaliMaltaMauritaniaMauritiusMexicoMiddle East & North AfricaMiddle East & North Africa (excluding high income)Middle East & North Africa (IDA & IBRD countries)Middle incomeMoldovaMongoliaMontenegroMoroccoMozambiqueMyanmarNamibiaNepalNetherlandsNew ZealandNicaraguaNigerNigeriaNorth AmericaNorwayOECD membersOmanOther small statesPakistanPanamaPapua New GuineaParaguayPeruPhilippinesPolandPortugalPost-demographic dividendPre-demographic dividendPuerto RicoQatarRomaniaRussian FederationRwandaSamoaSaudi ArabiaSenegalSerbiaSeychellesSierra LeoneSingaporeSlovak RepublicSloveniaSmall statesSomaliaSouth AfricaSouth AsiaSouth Asia (IDA & IBRD)South SudanSpainSri LankaSub-Saharan Africa Sub-Saharan Africa (excluding high income)Sub-Saharan Africa (IDA & IBRD countries)SudanSurinameSwazilandSwedenSwitzerlandSyrian Arab RepublicTajikistanTanzaniaThailandTimor-LesteTogoTrinidad and TobagoTunisiaTurkeyTurkmenistanUgandaUkraineUnited Arab EmiratesUnited KingdomUnited StatesUruguayUzbekistanVanuatuVenezuela, RBVietnamWest Bank and GazaWorldZambiaZimbabwe Timeline:
This timeline shows a graph from 1983 to 2016 of Antigua and Barbuda. No data until 1982. Number of actual observations by date: 34.
Source name:
World Development Indicators
Source organization:
World Bank national accounts data, and OECD National Accounts data files.
Categories, topics:
Economy & Growth, Trade
Last updated:
apr 23, 2017
Indicators value changes by year
Minimum:
-25.977
jan 1, 2010
Maximum:
40.738
jan 1, 1988
At the date of observation
Value
Absolute change
Change from previous value
jan 1, 1983
14.549
+14.549
0.0%
jan 1, 1984
10.677
-3.872
-26.61%
jan 1, 1985
-23.965
-34.642
-324.45%
jan 1, 1986
21.421
+45.386
-189.38%
jan 1, 1987
18.014
-3.407
-15.91%
jan 1, 1988
40.738
+22.724
126.15%
jan 1, 1989
-4.662
-45.4
-111.44%
jan 1, 1990
-16.525
-11.863
254.47%
jan 1, 1991
15.101
+31.626
-191.38%
jan 1, 1992
-1.382
-16.484
-109.15%
jan 1, 1993
2.894
+4.276
-309.33%
jan 1, 1994
5.227
+2.333
80.62%
jan 1, 1995
1.468
-3.759
-71.91%
jan 1, 1996
2.235
+0.767
52.23%
jan 1, 1997
0.854
-1.381
-61.8%
jan 1, 1998
2.91
+2.056
240.84%
jan 1, 1999
1.06
-1.851
-63.59%
jan 1, 2000
0.729
-0.331
-31.19%
jan 1, 2001
7.149
+6.42
880.28%
jan 1, 2002
-4.804
-11.953
-167.2%
jan 1, 2003
-5.469
-0.665
13.85%
jan 1, 2004
-3.606
+1.863
-34.06%
jan 1, 2005
13.829
+17.435
-483.46%
jan 1, 2006
6.925
-6.904
-49.93%
jan 1, 2007
11.305
+4.381
63.26%
jan 1, 2008
7.398
-3.907
-34.56%
jan 1, 2009
-0.769
-8.167
-110.4%
jan 1, 2010
-25.977
-25.207
3.28K%
jan 1, 2011
-6.609
+19.368
-74.56%
jan 1, 2012
-6.835
-0.226
3.42%
jan 1, 2013
6.36
+13.195
-193.06%
jan 1, 2014
4.613
-1.748
-27.48%
jan 1, 2015
5.559
+0.947
20.52%
jan 1, 2016
-8.127
-13.687
-246.19%
Ranking of countries by current statistics by years


Comments: