29
/
en
AIzaSyAYiBZKx7MnpbEhh9jyipgxe19OcubqV5w
April 1, 2024
124925
Egypt, Arab Rep.
EGY
true
2
1
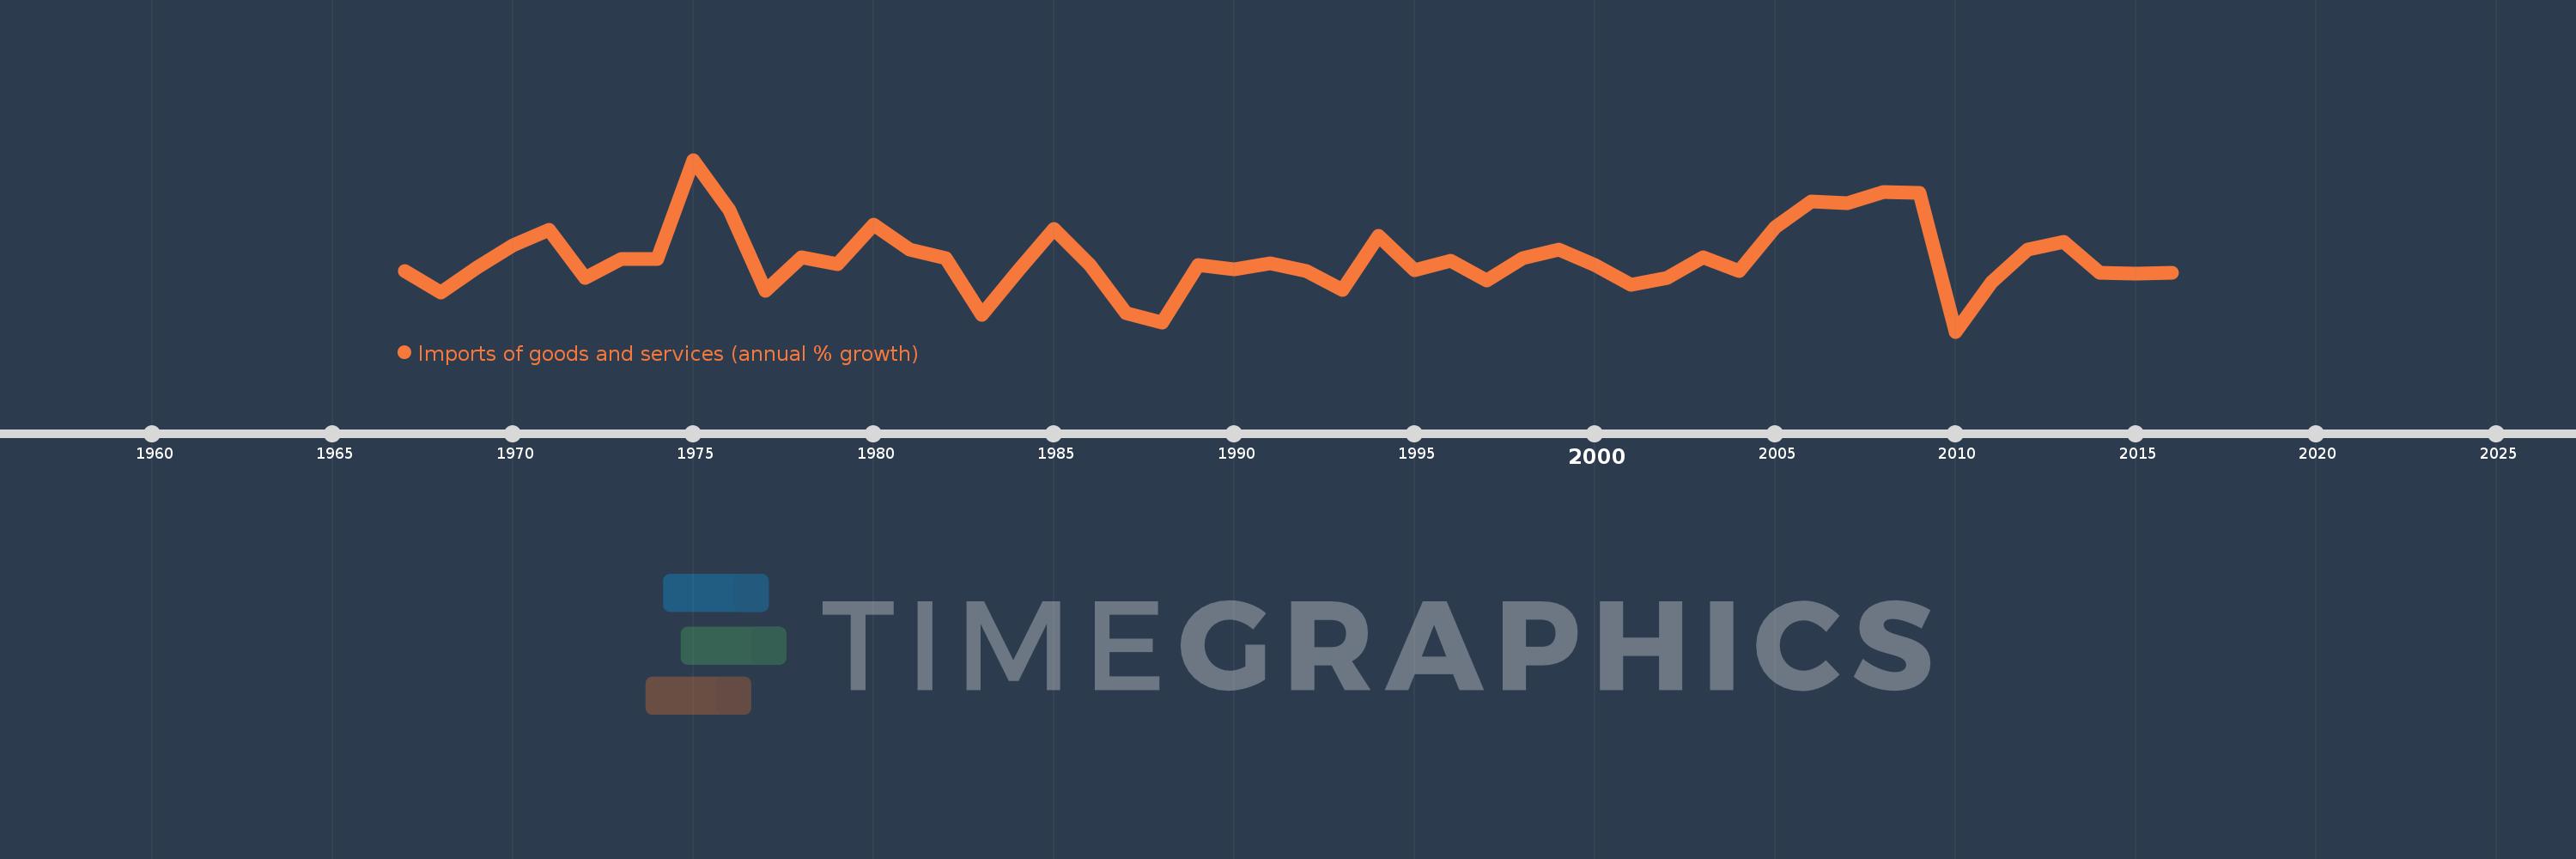
Imports of goods and services (annual % growth)
2016,2015,2014,2013,2012,2011,2010,2009,2008,2007,2006,2005,2004,2003,2002,2001,2000,1999,1998,1997,1996,1995,1994,1993,1992,1991,1990,1989,1988,1987,1986,1985,1984,1983,1982,1981,1980,1979,1978,1977,1976,1975,1974,1973,1972,1971,1970,1969,1968,1967
This statistics in other country:
AlbaniaAlgeriaAngolaAntigua and BarbudaArab WorldArgentinaArmeniaAustraliaAustriaAzerbaijanBahamas, TheBahrainBangladeshBarbadosBelarusBelgiumBelizeBeninBhutanBoliviaBosnia and HerzegovinaBotswanaBrazilBrunei DarussalamBulgariaBurkina FasoBurundiCabo VerdeCambodiaCameroonCanadaCaribbean small statesCentral Europe and the BalticsChadChileColombiaComorosCongo, Dem. Rep.Congo, Rep.Costa RicaCote d'IvoireCroatiaCubaCyprusCzech RepublicDenmarkDjiboutiDominican RepublicEarly-demographic dividendEast Asia & PacificEcuadorEgypt, Arab Rep.El SalvadorEquatorial GuineaEritreaEstoniaEthiopiaEuro areaEurope & Central AsiaEurope & Central Asia (excluding high income)Europe & Central Asia (IDA & IBRD countries)European UnionFijiFinlandFranceGabonGambia, TheGeorgiaGermanyGhanaGreeceGuatemalaGuineaGuinea-BissauHaitiHeavily indebted poor countries (HIPC)High incomeHondurasHong Kong SAR, ChinaHungaryIBRD onlyIcelandIDA & IBRD totalIDA blendIDA onlyIDA totalIndiaIndonesiaIran, Islamic Rep.IrelandIsraelItalyJamaicaJapanJordanKazakhstanKenyaKorea, Rep.KosovoKuwaitKyrgyz RepublicLao PDRLatin America & Caribbean Latin America & Caribbean (excluding high income)Latin America & the Caribbean (IDA & IBRD countries)LatviaLeast developed countries: UN classificationLebanonLiberiaLibyaLithuaniaLow & middle incomeLow incomeLower middle incomeLuxembourgMacao SAR, ChinaMacedonia, FYRMadagascarMalawiMalaysiaMaliMaltaMauritaniaMauritiusMexicoMiddle East & North AfricaMiddle East & North Africa (excluding high income)Middle East & North Africa (IDA & IBRD countries)Middle incomeMoldovaMongoliaMontenegroMoroccoMozambiqueMyanmarNamibiaNepalNetherlandsNew ZealandNicaraguaNigerNigeriaNorth AmericaNorwayOECD membersOmanOther small statesPakistanPanamaPapua New GuineaParaguayPeruPhilippinesPolandPortugalPost-demographic dividendPre-demographic dividendPuerto RicoQatarRomaniaRussian FederationRwandaSamoaSaudi ArabiaSenegalSerbiaSeychellesSierra LeoneSingaporeSlovak RepublicSloveniaSmall statesSomaliaSouth AfricaSouth AsiaSouth Asia (IDA & IBRD)South SudanSpainSri LankaSub-Saharan Africa Sub-Saharan Africa (excluding high income)Sub-Saharan Africa (IDA & IBRD countries)SudanSurinameSwazilandSwedenSwitzerlandSyrian Arab RepublicTajikistanTanzaniaThailandTimor-LesteTogoTrinidad and TobagoTunisiaTurkeyTurkmenistanUgandaUkraineUnited Arab EmiratesUnited KingdomUnited StatesUruguayUzbekistanVanuatuVenezuela, RBVietnamWest Bank and GazaWorldZambiaZimbabwe Timeline:
This timeline shows a graph from 1967 to 2016 of Egypt, Arab Rep.. No data until 1966. Number of actual observations by date: 50.
Source name:
World Development Indicators
Source organization:
World Bank national accounts data, and OECD National Accounts data files.
Categories, topics:
Economy & Growth, Trade
Last updated:
apr 23, 2017
Indicators value changes by year
Minimum:
-18.534
jan 1, 2010
Maximum:
37.156
jan 1, 1975
At the date of observation
Value
Absolute change
Change from previous value
jan 1, 1967
1.164
+1.164
0.0%
jan 1, 1968
-5.943
-7.107
-610.47%
jan 1, 1969
2.137
+8.08
-135.95%
jan 1, 1970
9.494
+7.357
344.35%
jan 1, 1971
14.337
+4.843
51.01%
jan 1, 1972
-1.2
-15.537
-108.37%
jan 1, 1973
4.915
+6.114
-509.68%
jan 1, 1974
5.015
+0.1
2.04%
jan 1, 1975
37.156
+32.14
640.87%
jan 1, 1976
20.729
-16.427
-44.21%
jan 1, 1977
-5.38
-26.109
-125.95%
jan 1, 1978
5.435
+10.815
-201.02%
jan 1, 1979
3.415
-2.019
-37.16%
jan 1, 1980
16.228
+12.813
375.17%
jan 1, 1981
8.127
-8.1
-49.92%
jan 1, 1982
5.353
-2.774
-34.13%
jan 1, 1983
-13.173
-18.526
-346.07%
jan 1, 1984
1.042
+14.215
-107.91%
jan 1, 1985
14.79
+13.748
1.32K%
jan 1, 1986
2.978
-11.812
-79.87%
jan 1, 1987
-12.674
-15.652
-525.62%
jan 1, 1988
-15.558
-2.883
22.75%
jan 1, 1989
3.068
+18.626
-119.72%
jan 1, 1990
1.653
-1.415
-46.13%
jan 1, 1991
3.659
+2.006
121.34%
jan 1, 1992
1.176
-2.482
-67.84%
jan 1, 1993
-4.957
-6.134
-521.38%
jan 1, 1994
12.558
+17.516
-353.32%
jan 1, 1995
1.24
-11.318
-90.13%
jan 1, 1996
4.49
+3.25
262.18%
jan 1, 1997
-1.953
-6.443
-143.5%
jan 1, 1998
5.378
+7.332
-375.38%
jan 1, 1999
8.006
+2.628
48.85%
jan 1, 2000
2.937
-5.069
-63.31%
jan 1, 2001
-3.397
-6.334
-215.65%
jan 1, 2002
-1.125
+2.272
-66.87%
jan 1, 2003
5.528
+6.653
-591.27%
jan 1, 2004
1.155
-4.373
-79.11%
jan 1, 2005
15.406
+14.251
1.23K%
jan 1, 2006
23.615
+8.209
53.29%
jan 1, 2007
23.195
-0.42
-1.78%
jan 1, 2008
26.732
+3.536
15.25%
jan 1, 2009
26.361
-0.371
-1.39%
jan 1, 2010
-18.534
-44.895
-170.31%
jan 1, 2011
-2.427
+16.107
-86.9%
jan 1, 2012
8.065
+10.492
-432.26%
jan 1, 2013
10.678
+2.613
32.4%
jan 1, 2014
0.516
-10.162
-95.17%
jan 1, 2015
0.171
-0.345
-66.84%
jan 1, 2016
0.61
+0.439
256.53%
Ranking of countries by current statistics by years


Comments: