29
/
en
AIzaSyAYiBZKx7MnpbEhh9jyipgxe19OcubqV5w
April 1, 2024
256453
Sweden
SWE
true
2
1
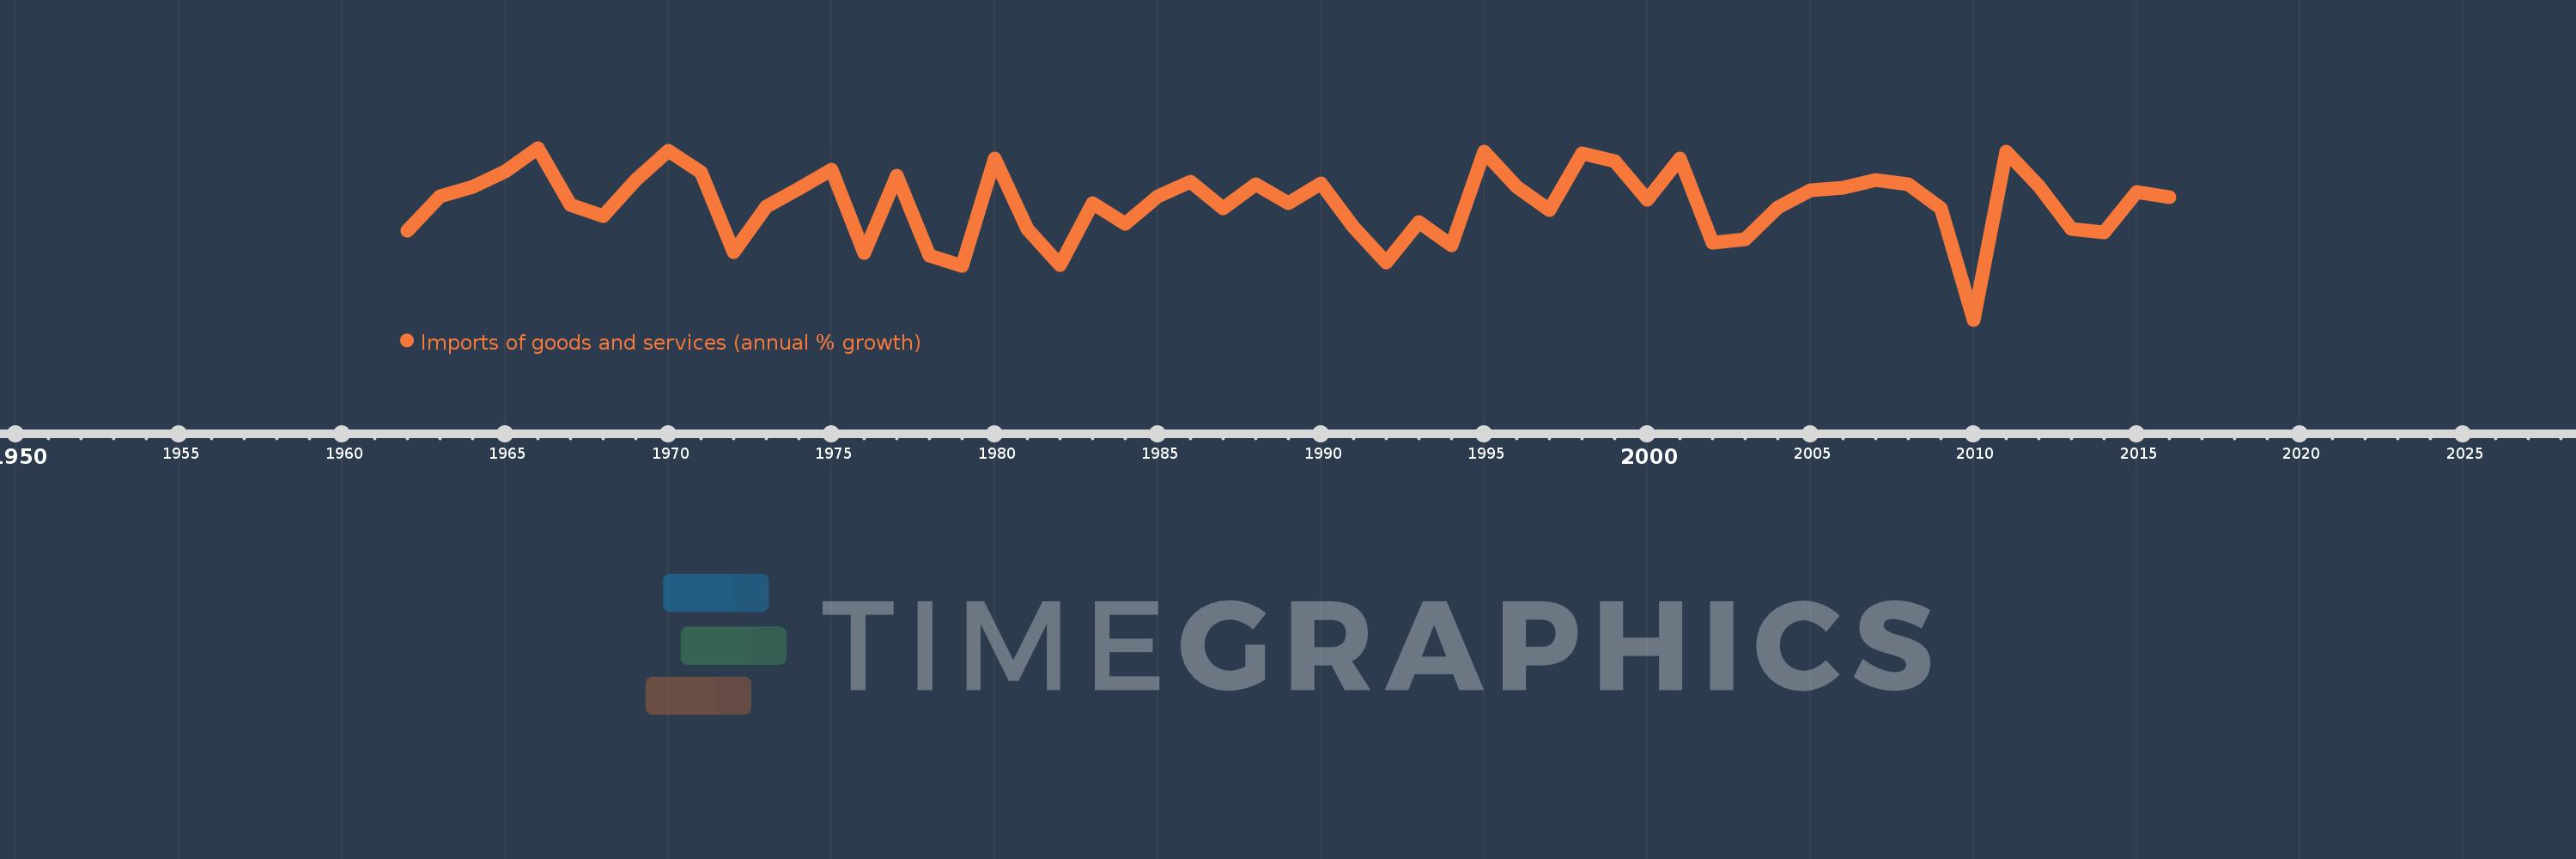
Imports of goods and services (annual % growth)
2016,2015,2014,2013,2012,2011,2010,2009,2008,2007,2006,2005,2004,2003,2002,2001,2000,1999,1998,1997,1996,1995,1994,1993,1992,1991,1990,1989,1988,1987,1986,1985,1984,1983,1982,1981,1980,1979,1978,1977,1976,1975,1974,1973,1972,1971,1970,1969,1968,1967,1966,1965,1964,1963,1962
This statistics in other country:
AlbaniaAlgeriaAngolaAntigua and BarbudaArab WorldArgentinaArmeniaAustraliaAustriaAzerbaijanBahamas, TheBahrainBangladeshBarbadosBelarusBelgiumBelizeBeninBhutanBoliviaBosnia and HerzegovinaBotswanaBrazilBrunei DarussalamBulgariaBurkina FasoBurundiCabo VerdeCambodiaCameroonCanadaCaribbean small statesCentral Europe and the BalticsChadChileColombiaComorosCongo, Dem. Rep.Congo, Rep.Costa RicaCote d'IvoireCroatiaCubaCyprusCzech RepublicDenmarkDjiboutiDominican RepublicEarly-demographic dividendEast Asia & PacificEcuadorEgypt, Arab Rep.El SalvadorEquatorial GuineaEritreaEstoniaEthiopiaEuro areaEurope & Central AsiaEurope & Central Asia (excluding high income)Europe & Central Asia (IDA & IBRD countries)European UnionFijiFinlandFranceGabonGambia, TheGeorgiaGermanyGhanaGreeceGuatemalaGuineaGuinea-BissauHaitiHeavily indebted poor countries (HIPC)High incomeHondurasHong Kong SAR, ChinaHungaryIBRD onlyIcelandIDA & IBRD totalIDA blendIDA onlyIDA totalIndiaIndonesiaIran, Islamic Rep.IrelandIsraelItalyJamaicaJapanJordanKazakhstanKenyaKorea, Rep.KosovoKuwaitKyrgyz RepublicLao PDRLatin America & Caribbean Latin America & Caribbean (excluding high income)Latin America & the Caribbean (IDA & IBRD countries)LatviaLeast developed countries: UN classificationLebanonLiberiaLibyaLithuaniaLow & middle incomeLow incomeLower middle incomeLuxembourgMacao SAR, ChinaMacedonia, FYRMadagascarMalawiMalaysiaMaliMaltaMauritaniaMauritiusMexicoMiddle East & North AfricaMiddle East & North Africa (excluding high income)Middle East & North Africa (IDA & IBRD countries)Middle incomeMoldovaMongoliaMontenegroMoroccoMozambiqueMyanmarNamibiaNepalNetherlandsNew ZealandNicaraguaNigerNigeriaNorth AmericaNorwayOECD membersOmanOther small statesPakistanPanamaPapua New GuineaParaguayPeruPhilippinesPolandPortugalPost-demographic dividendPre-demographic dividendPuerto RicoQatarRomaniaRussian FederationRwandaSamoaSaudi ArabiaSenegalSerbiaSeychellesSierra LeoneSingaporeSlovak RepublicSloveniaSmall statesSomaliaSouth AfricaSouth AsiaSouth Asia (IDA & IBRD)South SudanSpainSri LankaSub-Saharan Africa Sub-Saharan Africa (excluding high income)Sub-Saharan Africa (IDA & IBRD countries)SudanSurinameSwazilandSwedenSwitzerlandSyrian Arab RepublicTajikistanTanzaniaThailandTimor-LesteTogoTrinidad and TobagoTunisiaTurkeyTurkmenistanUgandaUkraineUnited Arab EmiratesUnited KingdomUnited StatesUruguayUzbekistanVanuatuVenezuela, RBVietnamWest Bank and GazaWorldZambiaZimbabwe Timeline:
This timeline shows a graph from 1962 to 2016 of Sweden. No data until 1961. Number of actual observations by date: 55.
Source name:
World Development Indicators
Source organization:
World Bank national accounts data, and OECD National Accounts data files.
Categories, topics:
Economy & Growth, Trade
Last updated:
apr 23, 2017
Indicators value changes by year
Minimum:
-14.078
jan 1, 2010
At the date of observation
Value
Absolute change
Change from previous value
jan 1, 1962
0.199
+0.199
0.0%
jan 1, 1963
5.679
+5.48
2.76K%
jan 1, 1964
7.141
+1.461
25.73%
jan 1, 1965
9.692
+2.551
35.73%
jan 1, 1966
13.38
+3.688
38.05%
jan 1, 1967
4.251
-9.128
-68.23%
jan 1, 1968
2.46
-1.791
-42.13%
jan 1, 1969
8.284
+5.824
236.72%
jan 1, 1970
12.897
+4.613
55.68%
jan 1, 1971
9.468
-3.428
-26.58%
jan 1, 1972
-3.321
-12.789
-135.07%
jan 1, 1973
3.973
+7.294
-219.66%
jan 1, 1974
6.926
+2.952
74.3%
jan 1, 1975
9.945
+3.019
43.59%
jan 1, 1976
-3.469
-13.414
-134.88%
jan 1, 1977
9.008
+12.477
-359.65%
jan 1, 1978
-3.754
-12.762
-141.67%
jan 1, 1979
-5.475
-1.721
45.86%
jan 1, 1980
11.623
+17.098
-312.27%
jan 1, 1981
0.434
-11.189
-96.27%
jan 1, 1982
-5.31
-5.744
-1.32K%
jan 1, 1983
4.615
+9.925
-186.9%
jan 1, 1984
1.229
-3.386
-73.37%
jan 1, 1985
5.687
+4.458
362.78%
jan 1, 1986
7.951
+2.264
39.82%
jan 1, 1987
3.771
-4.18
-52.57%
jan 1, 1988
7.611
+3.84
101.81%
jan 1, 1989
4.509
-3.102
-40.75%
jan 1, 1990
7.689
+3.18
70.52%
jan 1, 1991
0.661
-7.028
-91.4%
jan 1, 1992
-4.907
-5.568
-842.0%
jan 1, 1993
1.486
+6.393
-130.29%
jan 1, 1994
-2.16
-3.646
-245.31%
jan 1, 1995
12.857
+15.017
-695.32%
jan 1, 1996
7.123
-5.735
-44.6%
jan 1, 1997
3.442
-3.681
-51.68%
jan 1, 1998
12.447
+9.006
261.68%
jan 1, 1999
11.31
-1.138
-9.14%
jan 1, 2000
5.118
-6.191
-54.75%
jan 1, 2001
11.749
+6.631
129.55%
jan 1, 2002
-1.718
-13.467
-114.62%
jan 1, 2003
-1.255
+0.462
-26.92%
jan 1, 2004
3.82
+5.075
-404.31%
jan 1, 2005
6.606
+2.786
72.92%
jan 1, 2006
6.993
+0.387
5.86%
jan 1, 2007
8.225
+1.232
17.62%
jan 1, 2008
7.634
-0.591
-7.18%
jan 1, 2009
3.791
-3.843
-50.34%
jan 1, 2010
-14.078
-17.869
-471.31%
jan 1, 2011
12.778
+26.855
-190.77%
jan 1, 2012
7.343
-5.435
-42.53%
jan 1, 2013
0.482
-6.861
-93.43%
jan 1, 2014
-0.118
-0.6
-124.51%
jan 1, 2015
6.281
+6.399
-5.41K%
jan 1, 2016
5.486
-0.795
-12.66%
Ranking of countries by current statistics by years


Comments: