29
/
en
AIzaSyAYiBZKx7MnpbEhh9jyipgxe19OcubqV5w
April 1, 2024
245715
South Africa
ZAF
true
2
1
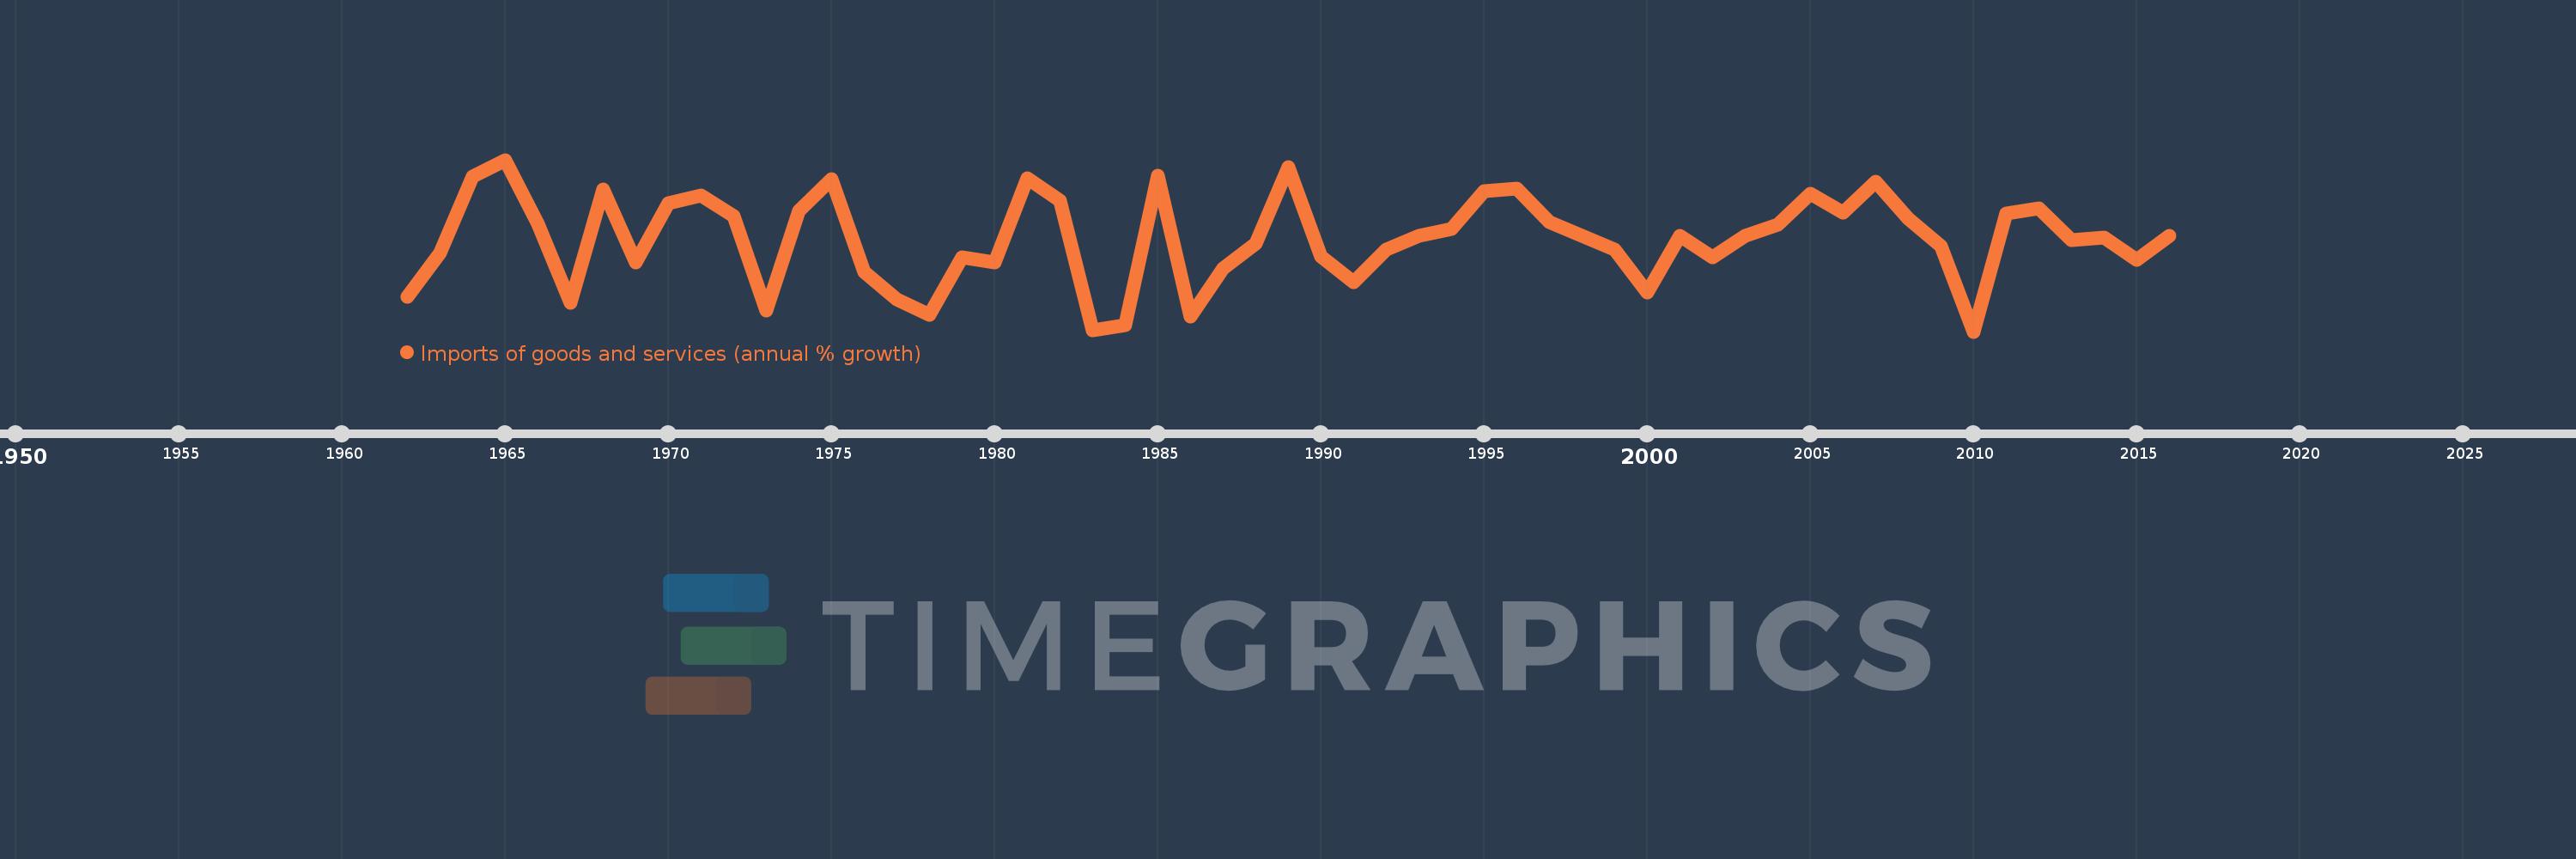
Imports of goods and services (annual % growth)
2016,2015,2014,2013,2012,2011,2010,2009,2008,2007,2006,2005,2004,2003,2002,2001,2000,1999,1998,1997,1996,1995,1994,1993,1992,1991,1990,1989,1988,1987,1986,1985,1984,1983,1982,1981,1980,1979,1978,1977,1976,1975,1974,1973,1972,1971,1970,1969,1968,1967,1966,1965,1964,1963,1962
This statistics in other country:
AlbaniaAlgeriaAngolaAntigua and BarbudaArab WorldArgentinaArmeniaAustraliaAustriaAzerbaijanBahamas, TheBahrainBangladeshBarbadosBelarusBelgiumBelizeBeninBhutanBoliviaBosnia and HerzegovinaBotswanaBrazilBrunei DarussalamBulgariaBurkina FasoBurundiCabo VerdeCambodiaCameroonCanadaCaribbean small statesCentral Europe and the BalticsChadChileColombiaComorosCongo, Dem. Rep.Congo, Rep.Costa RicaCote d'IvoireCroatiaCubaCyprusCzech RepublicDenmarkDjiboutiDominican RepublicEarly-demographic dividendEast Asia & PacificEcuadorEgypt, Arab Rep.El SalvadorEquatorial GuineaEritreaEstoniaEthiopiaEuro areaEurope & Central AsiaEurope & Central Asia (excluding high income)Europe & Central Asia (IDA & IBRD countries)European UnionFijiFinlandFranceGabonGambia, TheGeorgiaGermanyGhanaGreeceGuatemalaGuineaGuinea-BissauHaitiHeavily indebted poor countries (HIPC)High incomeHondurasHong Kong SAR, ChinaHungaryIBRD onlyIcelandIDA & IBRD totalIDA blendIDA onlyIDA totalIndiaIndonesiaIran, Islamic Rep.IrelandIsraelItalyJamaicaJapanJordanKazakhstanKenyaKorea, Rep.KosovoKuwaitKyrgyz RepublicLao PDRLatin America & Caribbean Latin America & Caribbean (excluding high income)Latin America & the Caribbean (IDA & IBRD countries)LatviaLeast developed countries: UN classificationLebanonLiberiaLibyaLithuaniaLow & middle incomeLow incomeLower middle incomeLuxembourgMacao SAR, ChinaMacedonia, FYRMadagascarMalawiMalaysiaMaliMaltaMauritaniaMauritiusMexicoMiddle East & North AfricaMiddle East & North Africa (excluding high income)Middle East & North Africa (IDA & IBRD countries)Middle incomeMoldovaMongoliaMontenegroMoroccoMozambiqueMyanmarNamibiaNepalNetherlandsNew ZealandNicaraguaNigerNigeriaNorth AmericaNorwayOECD membersOmanOther small statesPakistanPanamaPapua New GuineaParaguayPeruPhilippinesPolandPortugalPost-demographic dividendPre-demographic dividendPuerto RicoQatarRomaniaRussian FederationRwandaSamoaSaudi ArabiaSenegalSerbiaSeychellesSierra LeoneSingaporeSlovak RepublicSloveniaSmall statesSomaliaSouth AfricaSouth AsiaSouth Asia (IDA & IBRD)South SudanSpainSri LankaSub-Saharan Africa Sub-Saharan Africa (excluding high income)Sub-Saharan Africa (IDA & IBRD countries)SudanSurinameSwazilandSwedenSwitzerlandSyrian Arab RepublicTajikistanTanzaniaThailandTimor-LesteTogoTrinidad and TobagoTunisiaTurkeyTurkmenistanUgandaUkraineUnited Arab EmiratesUnited KingdomUnited StatesUruguayUzbekistanVanuatuVenezuela, RBVietnamWest Bank and GazaWorldZambiaZimbabwe Timeline:
This timeline shows a graph from 1962 to 2016 of South Africa. No data until 1961. Number of actual observations by date: 55.
Source name:
World Development Indicators
Source organization:
World Bank national accounts data, and OECD National Accounts data files.
Categories, topics:
Economy & Growth, Trade
Last updated:
apr 23, 2017
Indicators value changes by year
Minimum:
-17.66
jan 1, 2010
At the date of observation
Value
Absolute change
Change from previous value
jan 1, 1962
-9.235
-9.235
0.0%
jan 1, 1963
1.266
+10.501
-113.71%
jan 1, 1964
19.548
+18.282
1.44K%
jan 1, 1965
23.6
+4.052
20.73%
jan 1, 1966
8.311
-15.289
-64.78%
jan 1, 1967
-10.761
-19.072
-229.48%
jan 1, 1968
16.394
+27.155
-252.35%
jan 1, 1969
-1.147
-17.54
-106.99%
jan 1, 1970
13.135
+14.281
-1.25K%
jan 1, 1971
15.058
+1.923
14.64%
jan 1, 1972
10.087
-4.971
-33.01%
jan 1, 1973
-12.554
-22.641
-224.45%
jan 1, 1974
11.236
+23.79
-189.51%
jan 1, 1975
19.011
+7.775
69.19%
jan 1, 1976
-3.288
-22.299
-117.29%
jan 1, 1977
-10.003
-6.715
204.23%
jan 1, 1978
-13.677
-3.674
36.73%
jan 1, 1979
0.091
+13.767
-100.66%
jan 1, 1980
-0.96
-1.05
-1.16K%
jan 1, 1981
19.076
+20.036
-2.09K%
jan 1, 1982
13.735
-5.341
-28.0%
jan 1, 1983
-17.367
-31.102
-226.44%
jan 1, 1984
-16.092
+1.275
-7.34%
jan 1, 1985
19.799
+35.891
-223.04%
jan 1, 1986
-14.036
-33.835
-170.89%
jan 1, 1987
-2.453
+11.583
-82.53%
jan 1, 1988
3.494
+5.947
-242.46%
jan 1, 1989
21.909
+18.415
527.01%
jan 1, 1990
0.318
-21.592
-98.55%
jan 1, 1991
-5.837
-6.155
-1.94K%
jan 1, 1992
2.143
+7.98
-136.71%
jan 1, 1993
5.347
+3.205
149.56%
jan 1, 1994
7.017
+1.67
31.23%
jan 1, 1995
16.093
+9.076
129.33%
jan 1, 1996
16.79
+0.697
4.33%
jan 1, 1997
8.711
-8.08
-48.12%
jan 1, 1998
5.385
-3.325
-38.18%
jan 1, 1999
2.014
-3.372
-62.61%
jan 1, 2000
-8.362
-10.375
-515.25%
jan 1, 2001
5.338
+13.699
-163.83%
jan 1, 2002
0.25
-5.088
-95.32%
jan 1, 2003
5.341
+5.091
2.04K%
jan 1, 2004
8.085
+2.743
51.36%
jan 1, 2005
15.508
+7.424
91.83%
jan 1, 2006
10.879
-4.629
-29.85%
jan 1, 2007
18.261
+7.382
67.86%
jan 1, 2008
9.366
-8.895
-48.71%
jan 1, 2009
2.809
-6.557
-70.01%
jan 1, 2010
-17.66
-20.469
-728.67%
jan 1, 2011
10.794
+28.454
-161.12%
jan 1, 2012
11.912
+1.118
10.36%
jan 1, 2013
4.22
-7.692
-64.58%
jan 1, 2014
5.014
+0.795
18.83%
jan 1, 2015
-0.506
-5.52
-110.09%
jan 1, 2016
5.33
+5.836
-1.15K%
Ranking of countries by current statistics by years


Comments: