29
/
en
AIzaSyAYiBZKx7MnpbEhh9jyipgxe19OcubqV5w
April 1, 2024
277793
Uruguay
URY
true
2
1
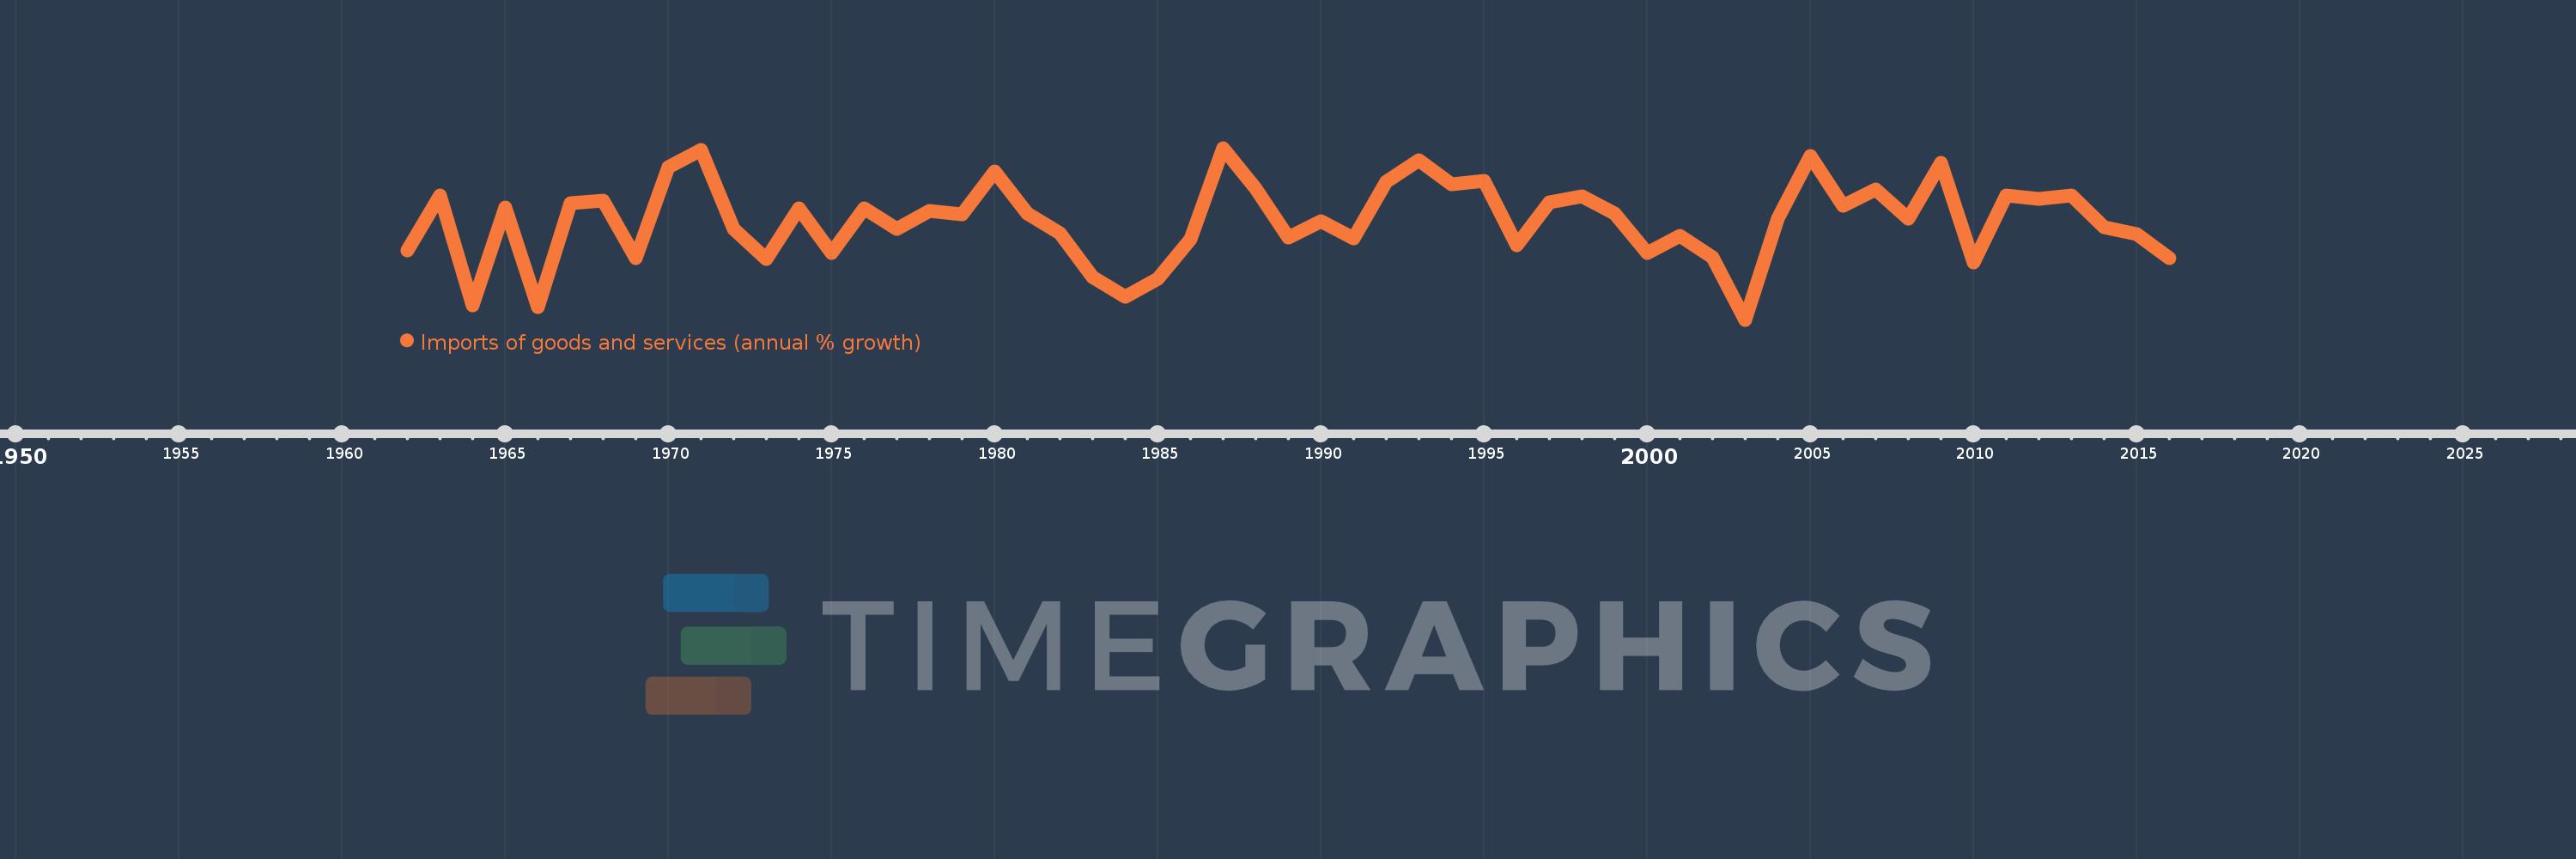
Imports of goods and services (annual % growth)
2016,2015,2014,2013,2012,2011,2010,2009,2008,2007,2006,2005,2004,2003,2002,2001,2000,1999,1998,1997,1996,1995,1994,1993,1992,1991,1990,1989,1988,1987,1986,1985,1984,1983,1982,1981,1980,1979,1978,1977,1976,1975,1974,1973,1972,1971,1970,1969,1968,1967,1966,1965,1964,1963,1962
This statistics in other country:
AlbaniaAlgeriaAngolaAntigua and BarbudaArab WorldArgentinaArmeniaAustraliaAustriaAzerbaijanBahamas, TheBahrainBangladeshBarbadosBelarusBelgiumBelizeBeninBhutanBoliviaBosnia and HerzegovinaBotswanaBrazilBrunei DarussalamBulgariaBurkina FasoBurundiCabo VerdeCambodiaCameroonCanadaCaribbean small statesCentral Europe and the BalticsChadChileColombiaComorosCongo, Dem. Rep.Congo, Rep.Costa RicaCote d'IvoireCroatiaCubaCyprusCzech RepublicDenmarkDjiboutiDominican RepublicEarly-demographic dividendEast Asia & PacificEcuadorEgypt, Arab Rep.El SalvadorEquatorial GuineaEritreaEstoniaEthiopiaEuro areaEurope & Central AsiaEurope & Central Asia (excluding high income)Europe & Central Asia (IDA & IBRD countries)European UnionFijiFinlandFranceGabonGambia, TheGeorgiaGermanyGhanaGreeceGuatemalaGuineaGuinea-BissauHaitiHeavily indebted poor countries (HIPC)High incomeHondurasHong Kong SAR, ChinaHungaryIBRD onlyIcelandIDA & IBRD totalIDA blendIDA onlyIDA totalIndiaIndonesiaIran, Islamic Rep.IrelandIsraelItalyJamaicaJapanJordanKazakhstanKenyaKorea, Rep.KosovoKuwaitKyrgyz RepublicLao PDRLatin America & Caribbean Latin America & Caribbean (excluding high income)Latin America & the Caribbean (IDA & IBRD countries)LatviaLeast developed countries: UN classificationLebanonLiberiaLibyaLithuaniaLow & middle incomeLow incomeLower middle incomeLuxembourgMacao SAR, ChinaMacedonia, FYRMadagascarMalawiMalaysiaMaliMaltaMauritaniaMauritiusMexicoMiddle East & North AfricaMiddle East & North Africa (excluding high income)Middle East & North Africa (IDA & IBRD countries)Middle incomeMoldovaMongoliaMontenegroMoroccoMozambiqueMyanmarNamibiaNepalNetherlandsNew ZealandNicaraguaNigerNigeriaNorth AmericaNorwayOECD membersOmanOther small statesPakistanPanamaPapua New GuineaParaguayPeruPhilippinesPolandPortugalPost-demographic dividendPre-demographic dividendPuerto RicoQatarRomaniaRussian FederationRwandaSamoaSaudi ArabiaSenegalSerbiaSeychellesSierra LeoneSingaporeSlovak RepublicSloveniaSmall statesSomaliaSouth AfricaSouth AsiaSouth Asia (IDA & IBRD)South SudanSpainSri LankaSub-Saharan Africa Sub-Saharan Africa (excluding high income)Sub-Saharan Africa (IDA & IBRD countries)SudanSurinameSwazilandSwedenSwitzerlandSyrian Arab RepublicTajikistanTanzaniaThailandTimor-LesteTogoTrinidad and TobagoTunisiaTurkeyTurkmenistanUgandaUkraineUnited Arab EmiratesUnited KingdomUnited StatesUruguayUzbekistanVanuatuVenezuela, RBVietnamWest Bank and GazaWorldZambiaZimbabwe Timeline:
This timeline shows a graph from 1962 to 2016 of Uruguay. No data until 1961. Number of actual observations by date: 55.
Source name:
World Development Indicators
Source organization:
World Bank national accounts data, and OECD National Accounts data files.
Categories, topics:
Economy & Growth, Trade
Last updated:
apr 23, 2017
Indicators value changes by year
Minimum:
-27.905
jan 1, 2003
Maximum:
29.358
jan 1, 1987
At the date of observation
Value
Absolute change
Change from previous value
jan 1, 1962
-4.886
-4.886
0.0%
jan 1, 1963
13.415
+18.301
-374.55%
jan 1, 1964
-23.257
-36.672
-273.37%
jan 1, 1965
9.419
+32.676
-140.5%
jan 1, 1966
-23.7
-33.119
-351.62%
jan 1, 1967
10.843
+34.543
-145.75%
jan 1, 1968
11.797
+0.955
8.81%
jan 1, 1969
-7.449
-19.246
-163.14%
jan 1, 1970
22.964
+30.413
-408.28%
jan 1, 1971
28.701
+5.738
24.99%
jan 1, 1972
2.39
-26.312
-91.67%
jan 1, 1973
-7.771
-10.16
-425.21%
jan 1, 1974
9.359
+17.13
-220.44%
jan 1, 1975
-5.667
-15.026
-160.55%
jan 1, 1976
9.134
+14.801
-261.19%
jan 1, 1977
2.262
-6.872
-75.24%
jan 1, 1978
8.276
+6.015
265.91%
jan 1, 1979
7.099
-1.177
-14.22%
jan 1, 1980
21.634
+14.535
204.74%
jan 1, 1981
7.619
-14.015
-64.78%
jan 1, 1982
1.008
-6.611
-86.77%
jan 1, 1983
-13.597
-14.605
-1.45K%
jan 1, 1984
-20.134
-6.536
48.07%
jan 1, 1985
-14.323
+5.81
-28.86%
jan 1, 1986
-1.052
+13.271
-92.65%
jan 1, 1987
29.358
+30.41
-2.89K%
jan 1, 1988
15.803
-13.555
-46.17%
jan 1, 1989
-0.419
-16.222
-102.65%
jan 1, 1990
4.946
+5.365
-1.28K%
jan 1, 1991
-0.657
-5.604
-113.29%
jan 1, 1992
18.078
+18.735
-2.85K%
jan 1, 1993
25.124
+7.046
38.98%
jan 1, 1994
17.225
-7.899
-31.44%
jan 1, 1995
18.271
+1.046
6.07%
jan 1, 1996
-3.037
-21.308
-116.62%
jan 1, 1997
11.331
+14.368
-473.13%
jan 1, 1998
13.245
+1.914
16.89%
jan 1, 1999
7.629
-5.617
-42.41%
jan 1, 2000
-5.789
-13.417
-175.88%
jan 1, 2001
0.07
+5.859
-101.21%
jan 1, 2002
-7.082
-7.152
-10.21K%
jan 1, 2003
-27.905
-20.823
294.05%
jan 1, 2004
5.804
+33.709
-120.8%
jan 1, 2005
26.775
+20.971
361.31%
jan 1, 2006
10.064
-16.711
-62.41%
jan 1, 2007
15.671
+5.607
55.71%
jan 1, 2008
5.924
-9.748
-62.2%
jan 1, 2009
24.435
+18.511
312.5%
jan 1, 2010
-8.666
-33.101
-135.47%
jan 1, 2011
13.578
+22.244
-256.68%
jan 1, 2012
12.409
-1.169
-8.61%
jan 1, 2013
13.638
+1.229
9.91%
jan 1, 2014
2.814
-10.824
-79.37%
jan 1, 2015
0.757
-2.057
-73.11%
jan 1, 2016
-7.4
-8.156
-1.08K%
Ranking of countries by current statistics by years


Comments: