29
/
en
AIzaSyAYiBZKx7MnpbEhh9jyipgxe19OcubqV5w
April 1, 2024
190363
Mali
MLI
true
2
1
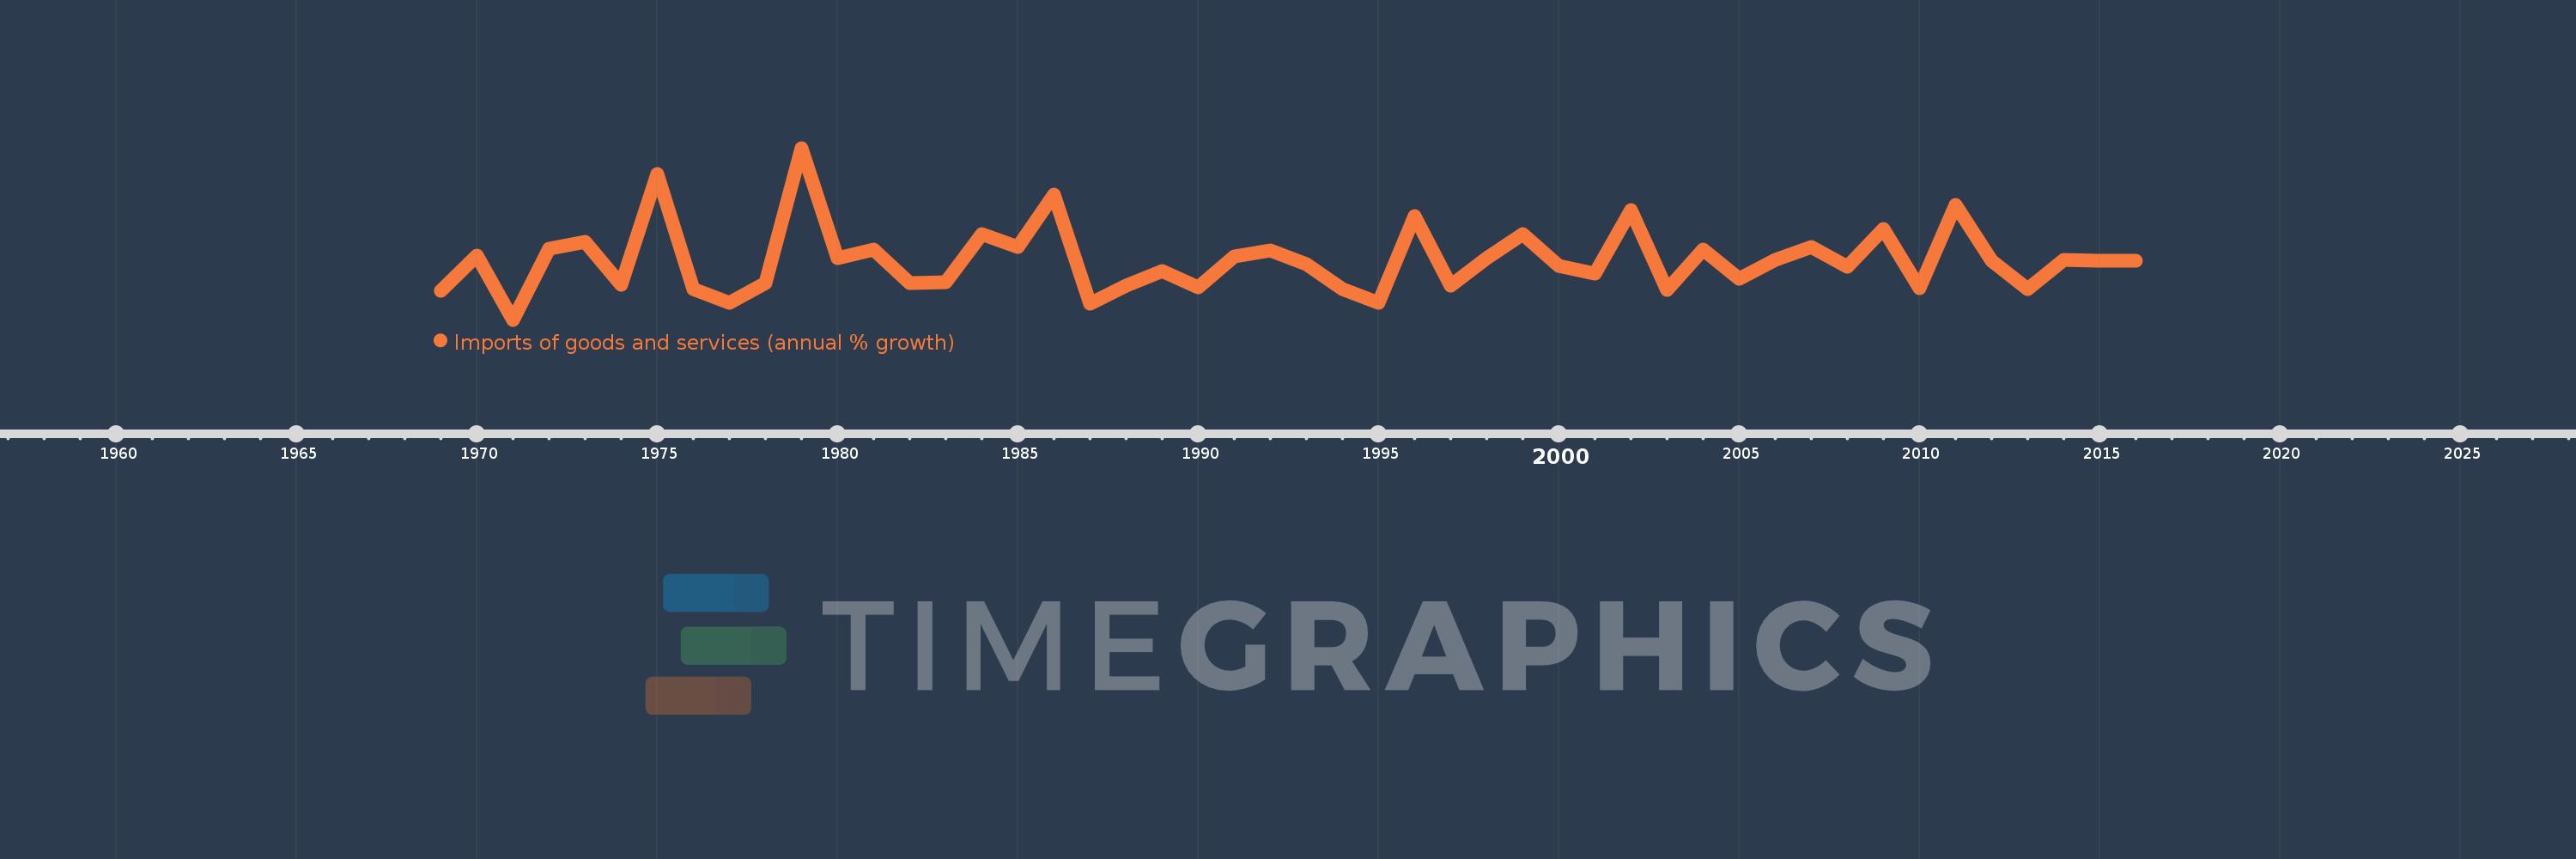
Imports of goods and services (annual % growth)
2016,2015,2014,2013,2012,2011,2010,2009,2008,2007,2006,2005,2004,2003,2002,2001,2000,1999,1998,1997,1996,1995,1994,1993,1992,1991,1990,1989,1988,1987,1986,1985,1984,1983,1982,1981,1980,1979,1978,1977,1976,1975,1974,1973,1972,1971,1970,1969
This statistics in other country:
AlbaniaAlgeriaAngolaAntigua and BarbudaArab WorldArgentinaArmeniaAustraliaAustriaAzerbaijanBahamas, TheBahrainBangladeshBarbadosBelarusBelgiumBelizeBeninBhutanBoliviaBosnia and HerzegovinaBotswanaBrazilBrunei DarussalamBulgariaBurkina FasoBurundiCabo VerdeCambodiaCameroonCanadaCaribbean small statesCentral Europe and the BalticsChadChileColombiaComorosCongo, Dem. Rep.Congo, Rep.Costa RicaCote d'IvoireCroatiaCubaCyprusCzech RepublicDenmarkDjiboutiDominican RepublicEarly-demographic dividendEast Asia & PacificEcuadorEgypt, Arab Rep.El SalvadorEquatorial GuineaEritreaEstoniaEthiopiaEuro areaEurope & Central AsiaEurope & Central Asia (excluding high income)Europe & Central Asia (IDA & IBRD countries)European UnionFijiFinlandFranceGabonGambia, TheGeorgiaGermanyGhanaGreeceGuatemalaGuineaGuinea-BissauHaitiHeavily indebted poor countries (HIPC)High incomeHondurasHong Kong SAR, ChinaHungaryIBRD onlyIcelandIDA & IBRD totalIDA blendIDA onlyIDA totalIndiaIndonesiaIran, Islamic Rep.IrelandIsraelItalyJamaicaJapanJordanKazakhstanKenyaKorea, Rep.KosovoKuwaitKyrgyz RepublicLao PDRLatin America & Caribbean Latin America & Caribbean (excluding high income)Latin America & the Caribbean (IDA & IBRD countries)LatviaLeast developed countries: UN classificationLebanonLiberiaLibyaLithuaniaLow & middle incomeLow incomeLower middle incomeLuxembourgMacao SAR, ChinaMacedonia, FYRMadagascarMalawiMalaysiaMaliMaltaMauritaniaMauritiusMexicoMiddle East & North AfricaMiddle East & North Africa (excluding high income)Middle East & North Africa (IDA & IBRD countries)Middle incomeMoldovaMongoliaMontenegroMoroccoMozambiqueMyanmarNamibiaNepalNetherlandsNew ZealandNicaraguaNigerNigeriaNorth AmericaNorwayOECD membersOmanOther small statesPakistanPanamaPapua New GuineaParaguayPeruPhilippinesPolandPortugalPost-demographic dividendPre-demographic dividendPuerto RicoQatarRomaniaRussian FederationRwandaSamoaSaudi ArabiaSenegalSerbiaSeychellesSierra LeoneSingaporeSlovak RepublicSloveniaSmall statesSomaliaSouth AfricaSouth AsiaSouth Asia (IDA & IBRD)South SudanSpainSri LankaSub-Saharan Africa Sub-Saharan Africa (excluding high income)Sub-Saharan Africa (IDA & IBRD countries)SudanSurinameSwazilandSwedenSwitzerlandSyrian Arab RepublicTajikistanTanzaniaThailandTimor-LesteTogoTrinidad and TobagoTunisiaTurkeyTurkmenistanUgandaUkraineUnited Arab EmiratesUnited KingdomUnited StatesUruguayUzbekistanVanuatuVenezuela, RBVietnamWest Bank and GazaWorldZambiaZimbabwe Timeline:
This timeline shows a graph from 1969 to 2016 of Mali. No data until 1968. Number of actual observations by date: 48.
Source name:
World Development Indicators
Source organization:
World Bank national accounts data, and OECD National Accounts data files.
Categories, topics:
Economy & Growth, Trade
Last updated:
apr 23, 2017
Indicators value changes by year
Minimum:
-16.668
jan 1, 1971
Maximum:
47.968
jan 1, 1979
At the date of observation
Value
Absolute change
Change from previous value
jan 1, 1969
-5.634
-5.634
0.0%
jan 1, 1970
7.464
+13.098
-232.49%
jan 1, 1971
-16.668
-24.132
-323.31%
jan 1, 1972
10.002
+26.669
-160.01%
jan 1, 1973
12.625
+2.623
26.23%
jan 1, 1974
-3.588
-16.213
-128.42%
jan 1, 1975
38.141
+41.729
-1.16K%
jan 1, 1976
-5.05
-43.192
-113.24%
jan 1, 1977
-10.284
-5.234
103.63%
jan 1, 1978
-2.767
+7.517
-73.09%
jan 1, 1979
47.968
+50.735
-1.83K%
jan 1, 1980
6.594
-41.375
-86.25%
jan 1, 1981
9.794
+3.201
48.54%
jan 1, 1982
-2.913
-12.707
-129.75%
jan 1, 1983
-2.431
+0.482
-16.56%
jan 1, 1984
15.414
+17.845
-734.1%
jan 1, 1985
10.608
-4.806
-31.18%
jan 1, 1986
30.508
+19.9
187.6%
jan 1, 1987
-10.533
-41.041
-134.52%
jan 1, 1988
-3.956
+6.577
-62.44%
jan 1, 1989
1.631
+5.587
-141.22%
jan 1, 1990
-4.629
-6.259
-383.85%
jan 1, 1991
7.211
+11.839
-255.79%
jan 1, 1992
9.567
+2.356
32.67%
jan 1, 1993
4.208
-5.359
-56.02%
jan 1, 1994
-5.257
-9.464
-224.93%
jan 1, 1995
-10.245
-4.989
94.9%
jan 1, 1996
22.195
+32.441
-316.64%
jan 1, 1997
-3.713
-25.909
-116.73%
jan 1, 1998
6.555
+10.269
-276.54%
jan 1, 1999
15.45
+8.895
135.69%
jan 1, 2000
3.454
-11.996
-77.65%
jan 1, 2001
0.551
-2.903
-84.05%
jan 1, 2002
24.444
+23.893
4.34K%
jan 1, 2003
-5.483
-29.927
-122.43%
jan 1, 2004
9.806
+15.289
-278.84%
jan 1, 2005
-1.12
-10.926
-111.42%
jan 1, 2006
5.751
+6.87
-613.54%
jan 1, 2007
10.667
+4.916
85.49%
jan 1, 2008
3.224
-7.442
-69.77%
jan 1, 2009
17.626
+14.402
446.69%
jan 1, 2010
-4.731
-22.357
-126.84%
jan 1, 2011
26.681
+31.412
-663.99%
jan 1, 2012
5.513
-21.168
-79.34%
jan 1, 2013
-5.287
-10.8
-195.88%
jan 1, 2014
5.939
+11.225
-212.34%
jan 1, 2015
5.525
-0.414
-6.97%
jan 1, 2016
5.674
+0.149
2.7%
Ranking of countries by current statistics by years


Comments: