29
/
en
AIzaSyAYiBZKx7MnpbEhh9jyipgxe19OcubqV5w
April 1, 2024
287334
Zimbabwe
ZWE
true
2
1
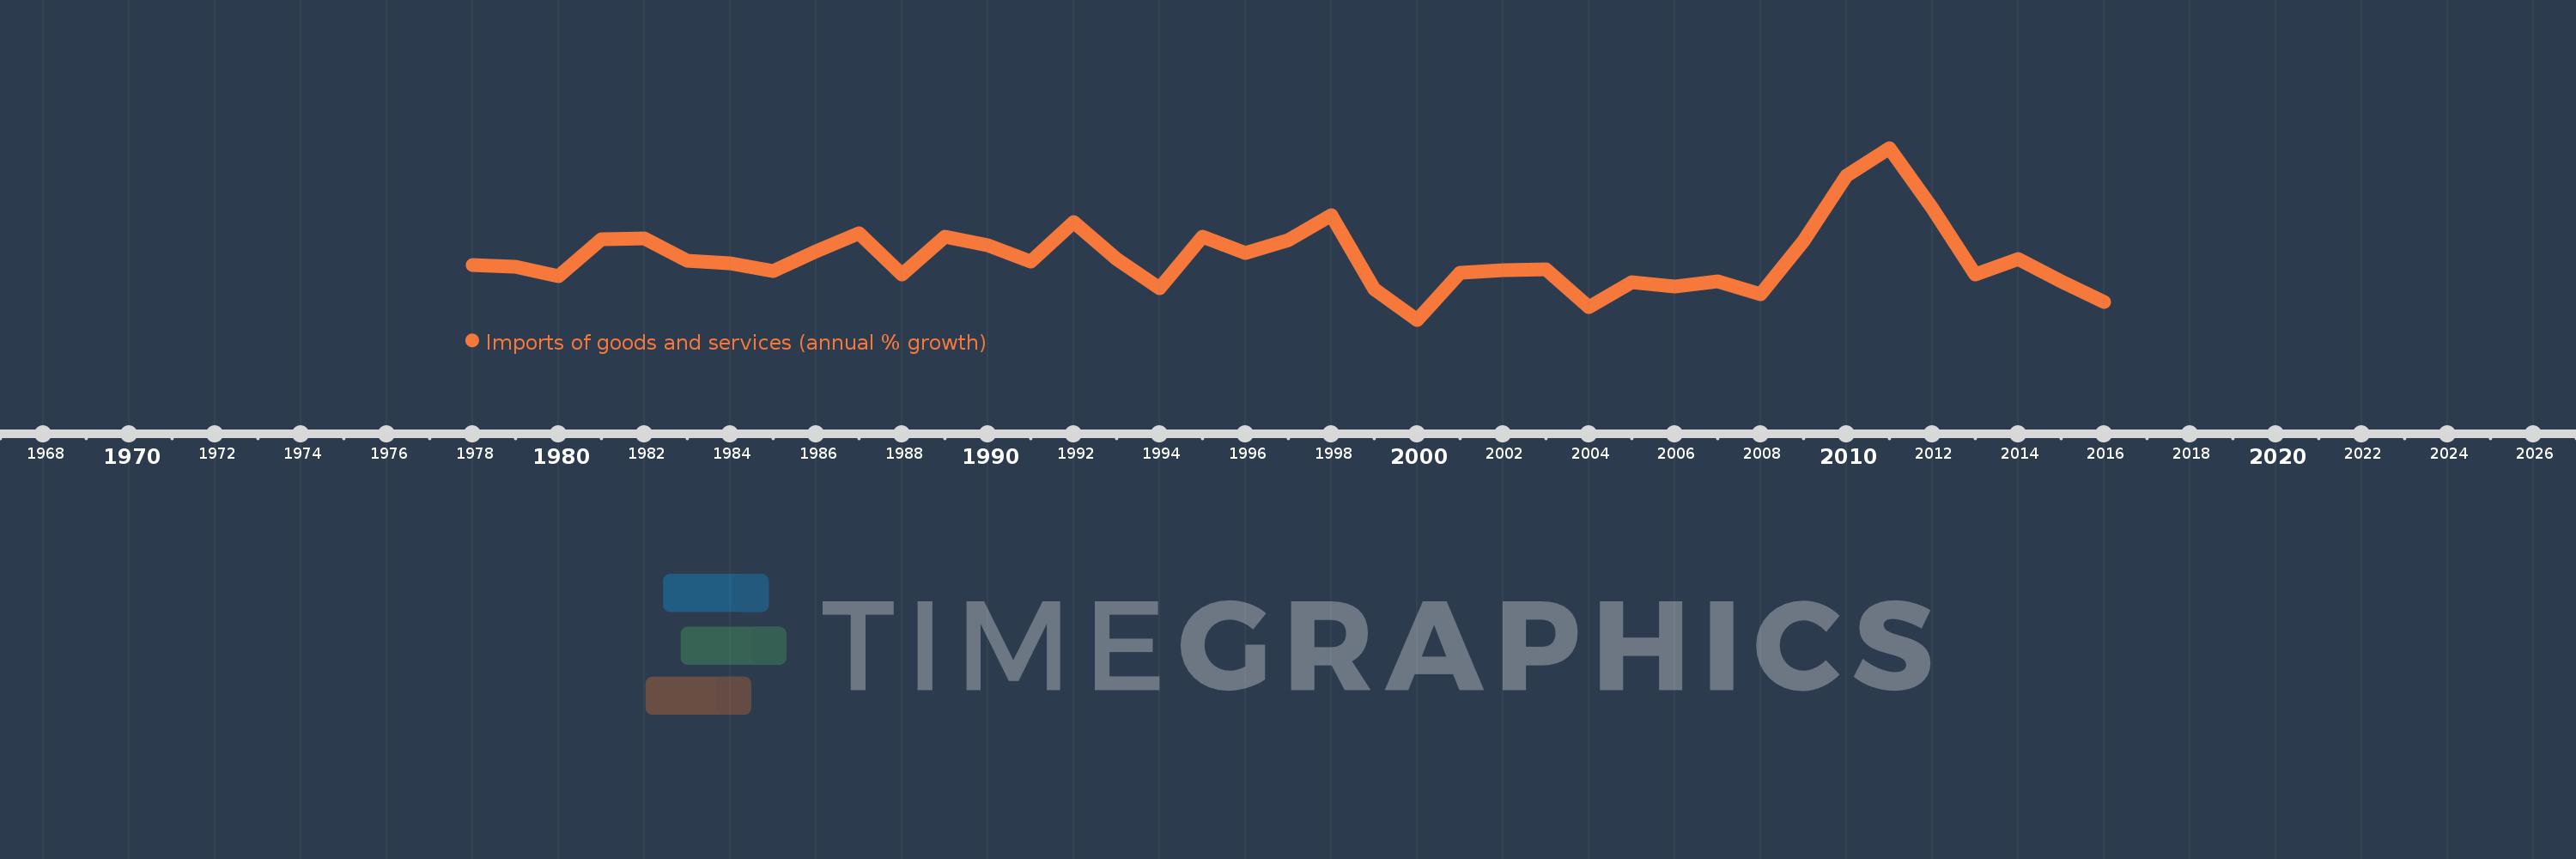
Imports of goods and services (annual % growth)
2016,2015,2014,2013,2012,2011,2010,2009,2008,2007,2006,2005,2004,2003,2002,2001,2000,1999,1998,1997,1996,1995,1994,1993,1992,1991,1990,1989,1988,1987,1986,1985,1984,1983,1982,1981,1980,1979,1978
This statistics in other country:
AlbaniaAlgeriaAngolaAntigua and BarbudaArab WorldArgentinaArmeniaAustraliaAustriaAzerbaijanBahamas, TheBahrainBangladeshBarbadosBelarusBelgiumBelizeBeninBhutanBoliviaBosnia and HerzegovinaBotswanaBrazilBrunei DarussalamBulgariaBurkina FasoBurundiCabo VerdeCambodiaCameroonCanadaCaribbean small statesCentral Europe and the BalticsChadChileColombiaComorosCongo, Dem. Rep.Congo, Rep.Costa RicaCote d'IvoireCroatiaCubaCyprusCzech RepublicDenmarkDjiboutiDominican RepublicEarly-demographic dividendEast Asia & PacificEcuadorEgypt, Arab Rep.El SalvadorEquatorial GuineaEritreaEstoniaEthiopiaEuro areaEurope & Central AsiaEurope & Central Asia (excluding high income)Europe & Central Asia (IDA & IBRD countries)European UnionFijiFinlandFranceGabonGambia, TheGeorgiaGermanyGhanaGreeceGuatemalaGuineaGuinea-BissauHaitiHeavily indebted poor countries (HIPC)High incomeHondurasHong Kong SAR, ChinaHungaryIBRD onlyIcelandIDA & IBRD totalIDA blendIDA onlyIDA totalIndiaIndonesiaIran, Islamic Rep.IrelandIsraelItalyJamaicaJapanJordanKazakhstanKenyaKorea, Rep.KosovoKuwaitKyrgyz RepublicLao PDRLatin America & Caribbean Latin America & Caribbean (excluding high income)Latin America & the Caribbean (IDA & IBRD countries)LatviaLeast developed countries: UN classificationLebanonLiberiaLibyaLithuaniaLow & middle incomeLow incomeLower middle incomeLuxembourgMacao SAR, ChinaMacedonia, FYRMadagascarMalawiMalaysiaMaliMaltaMauritaniaMauritiusMexicoMiddle East & North AfricaMiddle East & North Africa (excluding high income)Middle East & North Africa (IDA & IBRD countries)Middle incomeMoldovaMongoliaMontenegroMoroccoMozambiqueMyanmarNamibiaNepalNetherlandsNew ZealandNicaraguaNigerNigeriaNorth AmericaNorwayOECD membersOmanOther small statesPakistanPanamaPapua New GuineaParaguayPeruPhilippinesPolandPortugalPost-demographic dividendPre-demographic dividendPuerto RicoQatarRomaniaRussian FederationRwandaSamoaSaudi ArabiaSenegalSerbiaSeychellesSierra LeoneSingaporeSlovak RepublicSloveniaSmall statesSomaliaSouth AfricaSouth AsiaSouth Asia (IDA & IBRD)South SudanSpainSri LankaSub-Saharan Africa Sub-Saharan Africa (excluding high income)Sub-Saharan Africa (IDA & IBRD countries)SudanSurinameSwazilandSwedenSwitzerlandSyrian Arab RepublicTajikistanTanzaniaThailandTimor-LesteTogoTrinidad and TobagoTunisiaTurkeyTurkmenistanUgandaUkraineUnited Arab EmiratesUnited KingdomUnited StatesUruguayUzbekistanVanuatuVenezuela, RBVietnamWest Bank and GazaWorldZambiaZimbabwe Timeline:
This timeline shows a graph from 1978 to 2016 of Zimbabwe. No data until 1977. Number of actual observations by date: 39.
Source name:
World Development Indicators
Source organization:
World Bank national accounts data, and OECD National Accounts data files.
Categories, topics:
Economy & Growth, Trade
Last updated:
apr 23, 2017
Indicators value changes by year
Minimum:
-23.981
jan 1, 2000
Maximum:
53.387
jan 1, 2011
At the date of observation
Value
Absolute change
Change from previous value
jan 1, 1978
0.556
+0.556
0.0%
jan 1, 1979
-0.221
-0.777
-139.78%
jan 1, 1980
-4.546
-4.324
1.95K%
jan 1, 1981
12.28
+16.826
-370.15%
jan 1, 1982
12.525
+0.245
2.0%
jan 1, 1983
2.634
-9.891
-78.97%
jan 1, 1984
1.585
-1.049
-39.82%
jan 1, 1985
-1.907
-3.493
-220.31%
jan 1, 1986
6.943
+8.851
-464.03%
jan 1, 1987
15.154
+8.211
118.26%
jan 1, 1988
-3.731
-18.886
-124.62%
jan 1, 1989
13.245
+16.976
-454.96%
jan 1, 1990
9.58
-3.664
-27.67%
jan 1, 1991
2.147
-7.433
-77.59%
jan 1, 1992
20.135
+17.987
837.62%
jan 1, 1993
3.497
-16.638
-82.63%
jan 1, 1994
-9.767
-13.264
-379.32%
jan 1, 1995
13.534
+23.301
-238.57%
jan 1, 1996
6.17
-7.364
-54.41%
jan 1, 1997
11.789
+5.619
91.06%
jan 1, 1998
23.281
+11.492
97.48%
jan 1, 1999
-10.001
-33.282
-142.96%
jan 1, 2000
-23.981
-13.98
139.79%
jan 1, 2001
-2.82
+21.161
-88.24%
jan 1, 2002
-1.486
+1.334
-47.31%
jan 1, 2003
-1.375
+0.111
-7.45%
jan 1, 2004
-18.356
-16.981
1.23K%
jan 1, 2005
-7.246
+11.109
-60.52%
jan 1, 2006
-9.082
-1.836
25.33%
jan 1, 2007
-6.681
+2.402
-26.44%
jan 1, 2008
-12.667
-5.986
89.61%
jan 1, 2009
11.648
+24.315
-191.95%
jan 1, 2010
40.965
+29.317
251.69%
jan 1, 2011
53.387
+12.422
30.32%
jan 1, 2012
26.364
-27.023
-50.62%
jan 1, 2013
-3.59
-29.954
-113.62%
jan 1, 2014
3.461
+7.051
-196.39%
jan 1, 2015
-6.697
-10.157
-293.52%
jan 1, 2016
-16.158
-9.461
141.28%
Ranking of countries by current statistics by years


Comments: