29
/
en
AIzaSyAYiBZKx7MnpbEhh9jyipgxe19OcubqV5w
April 1, 2024
59879
Sub-Saharan Africa (excluding high income)
SSA
false
2
1
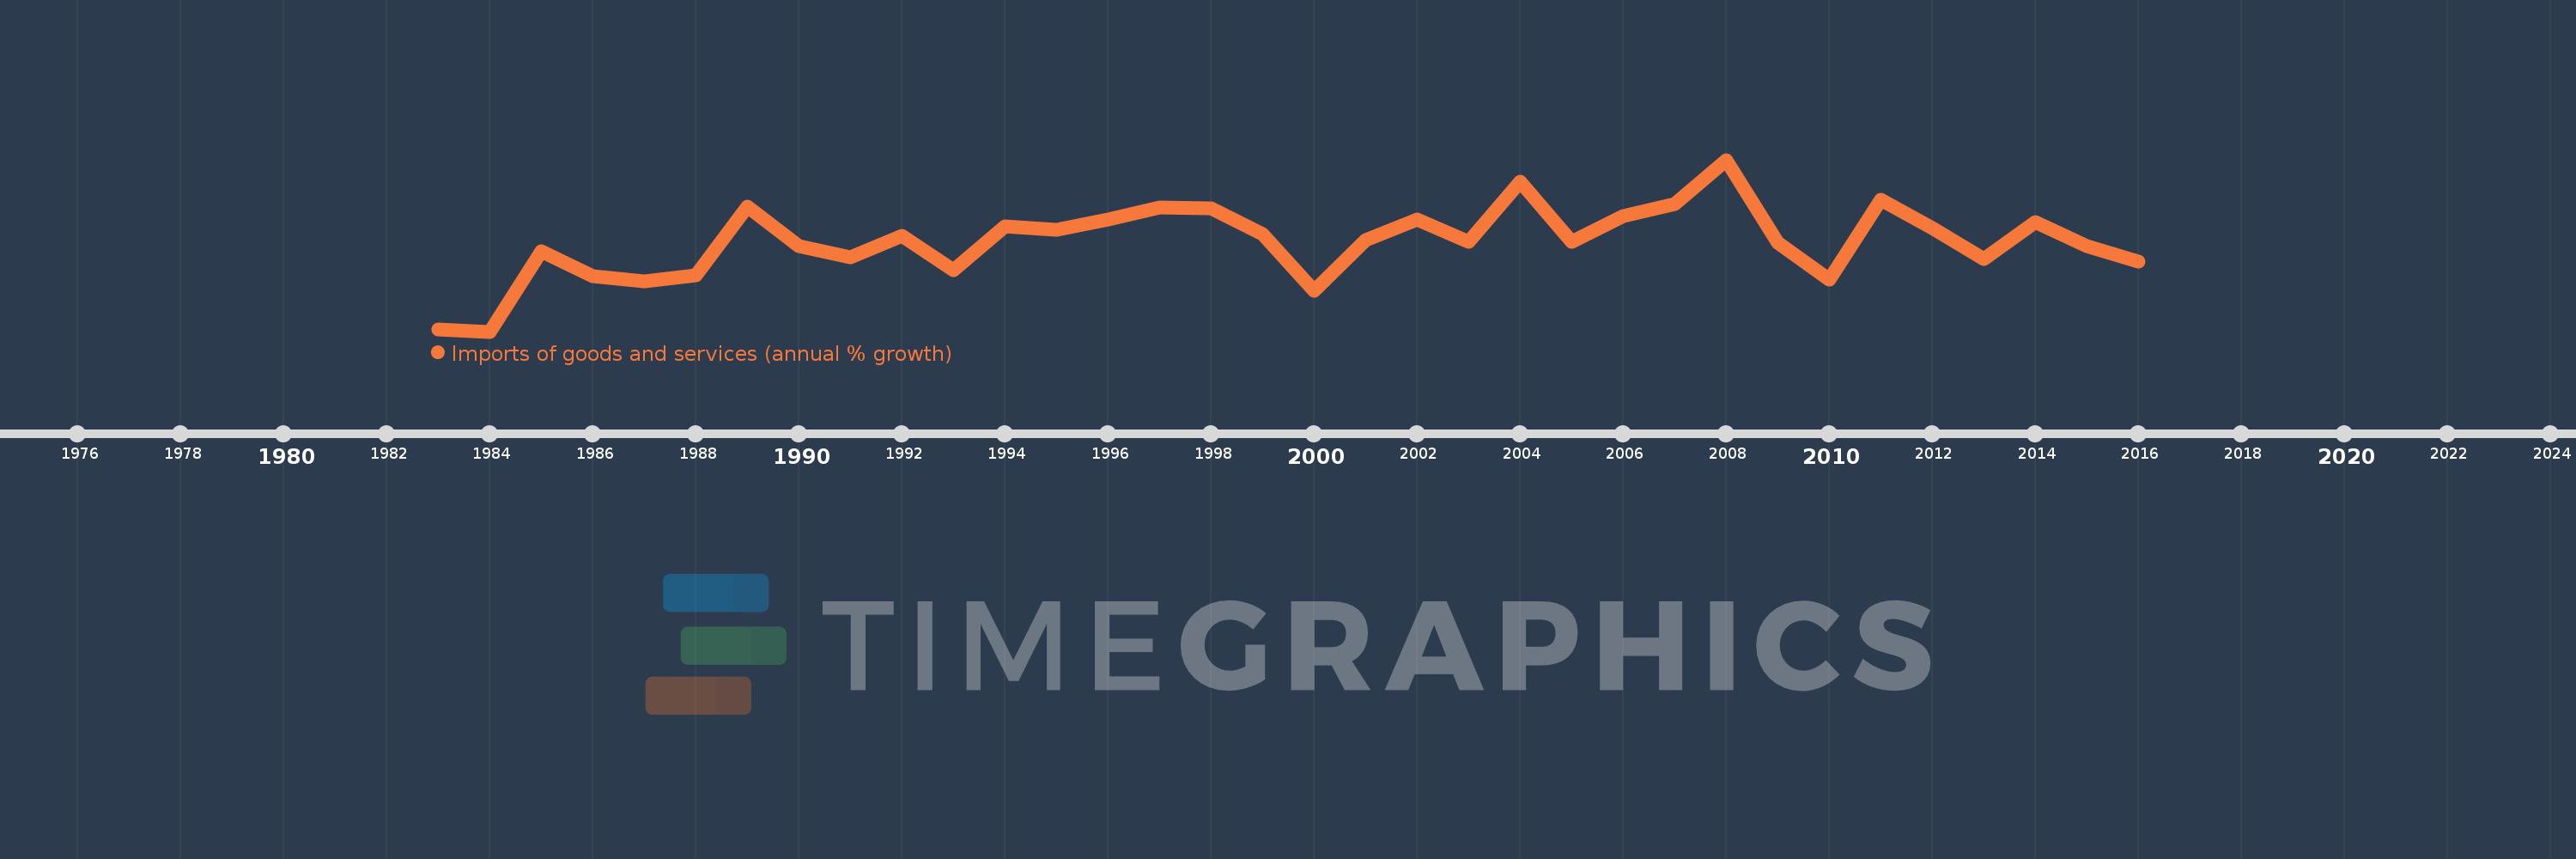
Imports of goods and services (annual % growth)
2016,2015,2014,2013,2012,2011,2010,2009,2008,2007,2006,2005,2004,2003,2002,2001,2000,1999,1998,1997,1996,1995,1994,1993,1992,1991,1990,1989,1988,1987,1986,1985,1984,1983
This statistics in other country:
AlbaniaAlgeriaAngolaAntigua and BarbudaArab WorldArgentinaArmeniaAustraliaAustriaAzerbaijanBahamas, TheBahrainBangladeshBarbadosBelarusBelgiumBelizeBeninBhutanBoliviaBosnia and HerzegovinaBotswanaBrazilBrunei DarussalamBulgariaBurkina FasoBurundiCabo VerdeCambodiaCameroonCanadaCaribbean small statesCentral Europe and the BalticsChadChileColombiaComorosCongo, Dem. Rep.Congo, Rep.Costa RicaCote d'IvoireCroatiaCubaCyprusCzech RepublicDenmarkDjiboutiDominican RepublicEarly-demographic dividendEast Asia & PacificEcuadorEgypt, Arab Rep.El SalvadorEquatorial GuineaEritreaEstoniaEthiopiaEuro areaEurope & Central AsiaEurope & Central Asia (excluding high income)Europe & Central Asia (IDA & IBRD countries)European UnionFijiFinlandFranceGabonGambia, TheGeorgiaGermanyGhanaGreeceGuatemalaGuineaGuinea-BissauHaitiHeavily indebted poor countries (HIPC)High incomeHondurasHong Kong SAR, ChinaHungaryIBRD onlyIcelandIDA & IBRD totalIDA blendIDA onlyIDA totalIndiaIndonesiaIran, Islamic Rep.IrelandIsraelItalyJamaicaJapanJordanKazakhstanKenyaKorea, Rep.KosovoKuwaitKyrgyz RepublicLao PDRLatin America & Caribbean Latin America & Caribbean (excluding high income)Latin America & the Caribbean (IDA & IBRD countries)LatviaLeast developed countries: UN classificationLebanonLiberiaLibyaLithuaniaLow & middle incomeLow incomeLower middle incomeLuxembourgMacao SAR, ChinaMacedonia, FYRMadagascarMalawiMalaysiaMaliMaltaMauritaniaMauritiusMexicoMiddle East & North AfricaMiddle East & North Africa (excluding high income)Middle East & North Africa (IDA & IBRD countries)Middle incomeMoldovaMongoliaMontenegroMoroccoMozambiqueMyanmarNamibiaNepalNetherlandsNew ZealandNicaraguaNigerNigeriaNorth AmericaNorwayOECD membersOmanOther small statesPakistanPanamaPapua New GuineaParaguayPeruPhilippinesPolandPortugalPost-demographic dividendPre-demographic dividendPuerto RicoQatarRomaniaRussian FederationRwandaSamoaSaudi ArabiaSenegalSerbiaSeychellesSierra LeoneSingaporeSlovak RepublicSloveniaSmall statesSomaliaSouth AfricaSouth AsiaSouth Asia (IDA & IBRD)South SudanSpainSri LankaSub-Saharan Africa Sub-Saharan Africa (excluding high income)Sub-Saharan Africa (IDA & IBRD countries)SudanSurinameSwazilandSwedenSwitzerlandSyrian Arab RepublicTajikistanTanzaniaThailandTimor-LesteTogoTrinidad and TobagoTunisiaTurkeyTurkmenistanUgandaUkraineUnited Arab EmiratesUnited KingdomUnited StatesUruguayUzbekistanVanuatuVenezuela, RBVietnamWest Bank and GazaWorldZambiaZimbabwe Timeline:
This timeline shows a graph from 1983 to 2016 of Sub-Saharan Africa (excluding high income). No data until 1982. Number of actual observations by date: 34.
Source name:
World Development Indicators
Source organization:
World Bank national accounts data, and OECD National Accounts data files.
Categories, topics:
Economy & Growth, Trade
Last updated:
apr 23, 2017
Indicators value changes by year
Minimum:
-16.236
jan 1, 1984
Maximum:
21.845
jan 1, 2008
At the date of observation
Value
Absolute change
Change from previous value
jan 1, 1983
-15.77
-15.77
0.0%
jan 1, 1984
-16.236
-0.467
2.96%
jan 1, 1985
1.563
+17.799
-109.63%
jan 1, 1986
-3.903
-5.466
-349.67%
jan 1, 1987
-5.103
-1.2
30.76%
jan 1, 1988
-3.774
+1.329
-26.04%
jan 1, 1989
11.521
+15.295
-405.27%
jan 1, 1990
2.795
-8.726
-75.74%
jan 1, 1991
0.186
-2.609
-93.34%
jan 1, 1992
4.983
+4.797
2.58K%
jan 1, 1993
-2.641
-7.624
-152.99%
jan 1, 1994
7.065
+9.705
-367.54%
jan 1, 1995
6.298
-0.767
-10.86%
jan 1, 1996
8.578
+2.28
36.2%
jan 1, 1997
11.367
+2.789
32.51%
jan 1, 1998
11.066
-0.301
-2.65%
jan 1, 1999
5.312
-5.753
-51.99%
jan 1, 2000
-7.139
-12.452
-234.39%
jan 1, 2001
3.997
+11.136
-155.99%
jan 1, 2002
8.601
+4.604
115.19%
jan 1, 2003
3.628
-4.973
-57.82%
jan 1, 2004
16.996
+13.368
368.43%
jan 1, 2005
3.58
-13.416
-78.94%
jan 1, 2006
9.465
+5.885
164.4%
jan 1, 2007
12.076
+2.61
27.58%
jan 1, 2008
21.845
+9.769
80.9%
jan 1, 2009
3.414
-18.43
-84.37%
jan 1, 2010
-4.652
-8.066
-236.25%
jan 1, 2011
13.052
+17.704
-380.58%
jan 1, 2012
6.692
-6.36
-48.72%
jan 1, 2013
-0.233
-6.926
-103.49%
jan 1, 2014
7.988
+8.221
-3.52K%
jan 1, 2015
2.778
-5.21
-65.22%
jan 1, 2016
-0.727
-3.505
-126.19%
Ranking of countries by current statistics by years


Comments: