29
/
en
AIzaSyAYiBZKx7MnpbEhh9jyipgxe19OcubqV5w
April 1, 2024
276763
United States
USA
true
2
1
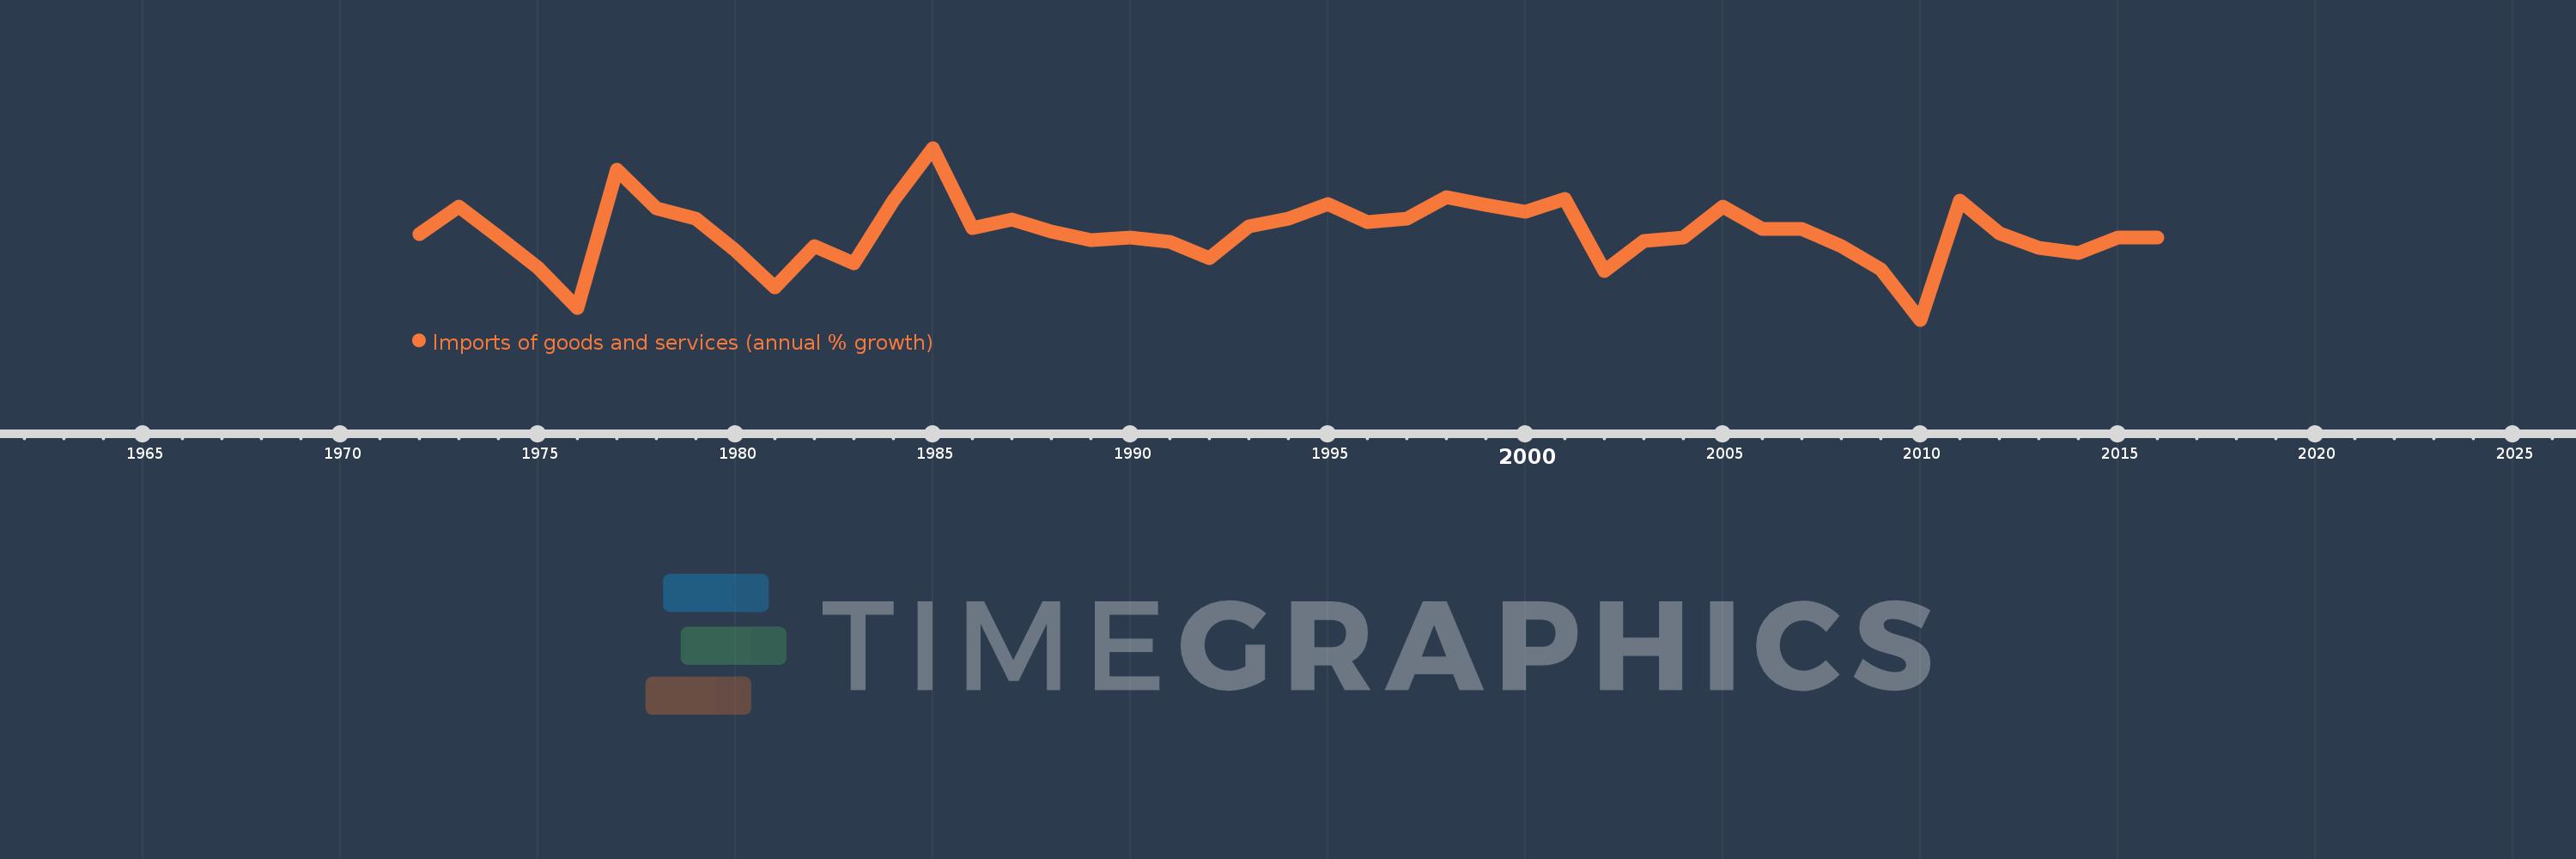
Imports of goods and services (annual % growth)
2016,2015,2014,2013,2012,2011,2010,2009,2008,2007,2006,2005,2004,2003,2002,2001,2000,1999,1998,1997,1996,1995,1994,1993,1992,1991,1990,1989,1988,1987,1986,1985,1984,1983,1982,1981,1980,1979,1978,1977,1976,1975,1974,1973,1972
This statistics in other country:
AlbaniaAlgeriaAngolaAntigua and BarbudaArab WorldArgentinaArmeniaAustraliaAustriaAzerbaijanBahamas, TheBahrainBangladeshBarbadosBelarusBelgiumBelizeBeninBhutanBoliviaBosnia and HerzegovinaBotswanaBrazilBrunei DarussalamBulgariaBurkina FasoBurundiCabo VerdeCambodiaCameroonCanadaCaribbean small statesCentral Europe and the BalticsChadChileColombiaComorosCongo, Dem. Rep.Congo, Rep.Costa RicaCote d'IvoireCroatiaCubaCyprusCzech RepublicDenmarkDjiboutiDominican RepublicEarly-demographic dividendEast Asia & PacificEcuadorEgypt, Arab Rep.El SalvadorEquatorial GuineaEritreaEstoniaEthiopiaEuro areaEurope & Central AsiaEurope & Central Asia (excluding high income)Europe & Central Asia (IDA & IBRD countries)European UnionFijiFinlandFranceGabonGambia, TheGeorgiaGermanyGhanaGreeceGuatemalaGuineaGuinea-BissauHaitiHeavily indebted poor countries (HIPC)High incomeHondurasHong Kong SAR, ChinaHungaryIBRD onlyIcelandIDA & IBRD totalIDA blendIDA onlyIDA totalIndiaIndonesiaIran, Islamic Rep.IrelandIsraelItalyJamaicaJapanJordanKazakhstanKenyaKorea, Rep.KosovoKuwaitKyrgyz RepublicLao PDRLatin America & Caribbean Latin America & Caribbean (excluding high income)Latin America & the Caribbean (IDA & IBRD countries)LatviaLeast developed countries: UN classificationLebanonLiberiaLibyaLithuaniaLow & middle incomeLow incomeLower middle incomeLuxembourgMacao SAR, ChinaMacedonia, FYRMadagascarMalawiMalaysiaMaliMaltaMauritaniaMauritiusMexicoMiddle East & North AfricaMiddle East & North Africa (excluding high income)Middle East & North Africa (IDA & IBRD countries)Middle incomeMoldovaMongoliaMontenegroMoroccoMozambiqueMyanmarNamibiaNepalNetherlandsNew ZealandNicaraguaNigerNigeriaNorth AmericaNorwayOECD membersOmanOther small statesPakistanPanamaPapua New GuineaParaguayPeruPhilippinesPolandPortugalPost-demographic dividendPre-demographic dividendPuerto RicoQatarRomaniaRussian FederationRwandaSamoaSaudi ArabiaSenegalSerbiaSeychellesSierra LeoneSingaporeSlovak RepublicSloveniaSmall statesSomaliaSouth AfricaSouth AsiaSouth Asia (IDA & IBRD)South SudanSpainSri LankaSub-Saharan Africa Sub-Saharan Africa (excluding high income)Sub-Saharan Africa (IDA & IBRD countries)SudanSurinameSwazilandSwedenSwitzerlandSyrian Arab RepublicTajikistanTanzaniaThailandTimor-LesteTogoTrinidad and TobagoTunisiaTurkeyTurkmenistanUgandaUkraineUnited Arab EmiratesUnited KingdomUnited StatesUruguayUzbekistanVanuatuVenezuela, RBVietnamWest Bank and GazaWorldZambiaZimbabwe Timeline:
This timeline shows a graph from 1972 to 2016 of United States. No data until 1971. Number of actual observations by date: 45.
Source name:
World Development Indicators
Source organization:
World Bank national accounts data, and OECD National Accounts data files.
Categories, topics:
Economy & Growth, Trade
Last updated:
apr 23, 2017
Indicators value changes by year
Minimum:
-13.724
jan 1, 2010
Maximum:
24.343
jan 1, 1985
At the date of observation
Value
Absolute change
Change from previous value
jan 1, 1972
5.337
+5.337
0.0%
jan 1, 1973
11.253
+5.916
110.84%
jan 1, 1974
4.64
-6.613
-58.76%
jan 1, 1975
-2.265
-6.905
-148.81%
jan 1, 1976
-11.115
-8.85
390.77%
jan 1, 1977
19.555
+30.67
-275.93%
jan 1, 1978
10.932
-8.622
-44.09%
jan 1, 1979
8.664
-2.268
-20.75%
jan 1, 1980
1.661
-7.003
-80.83%
jan 1, 1981
-6.641
-8.302
-499.8%
jan 1, 1982
2.642
+9.282
-139.78%
jan 1, 1983
-1.259
-3.901
-147.64%
jan 1, 1984
12.617
+13.876
-1.1K%
jan 1, 1985
24.343
+11.726
92.94%
jan 1, 1986
6.49
-17.853
-73.34%
jan 1, 1987
8.544
+2.053
31.64%
jan 1, 1988
5.918
-2.626
-30.73%
jan 1, 1989
3.928
-1.99
-33.62%
jan 1, 1990
4.403
+0.475
12.09%
jan 1, 1991
3.577
-0.826
-18.76%
jan 1, 1992
-0.15
-3.727
-104.18%
jan 1, 1993
7.01
+7.159
-4.78K%
jan 1, 1994
8.647
+1.637
23.35%
jan 1, 1995
11.928
+3.282
37.95%
jan 1, 1996
8.001
-3.928
-32.93%
jan 1, 1997
8.697
+0.696
8.7%
jan 1, 1998
13.468
+4.772
54.87%
jan 1, 1999
11.689
-1.78
-13.21%
jan 1, 2000
10.14
-1.549
-13.25%
jan 1, 2001
13.018
+2.878
28.38%
jan 1, 2002
-2.837
-15.854
-121.79%
jan 1, 2003
3.665
+6.502
-229.21%
jan 1, 2004
4.465
+0.8
21.83%
jan 1, 2005
11.411
+6.946
155.55%
jan 1, 2006
6.332
-5.079
-44.51%
jan 1, 2007
6.322
-0.01
-0.15%
jan 1, 2008
2.519
-3.803
-60.15%
jan 1, 2009
-2.559
-5.078
-201.57%
jan 1, 2010
-13.724
-11.165
436.31%
jan 1, 2011
12.716
+26.44
-192.65%
jan 1, 2012
5.472
-7.244
-56.97%
jan 1, 2013
2.23
-3.242
-59.25%
jan 1, 2014
1.087
-1.143
-51.26%
jan 1, 2015
4.415
+3.328
306.2%
jan 1, 2016
4.581
+0.167
3.78%
Ranking of countries by current statistics by years


Comments: