29
/
en
AIzaSyAYiBZKx7MnpbEhh9jyipgxe19OcubqV5w
April 1, 2024
156114
Indonesia
IDN
true
2
1
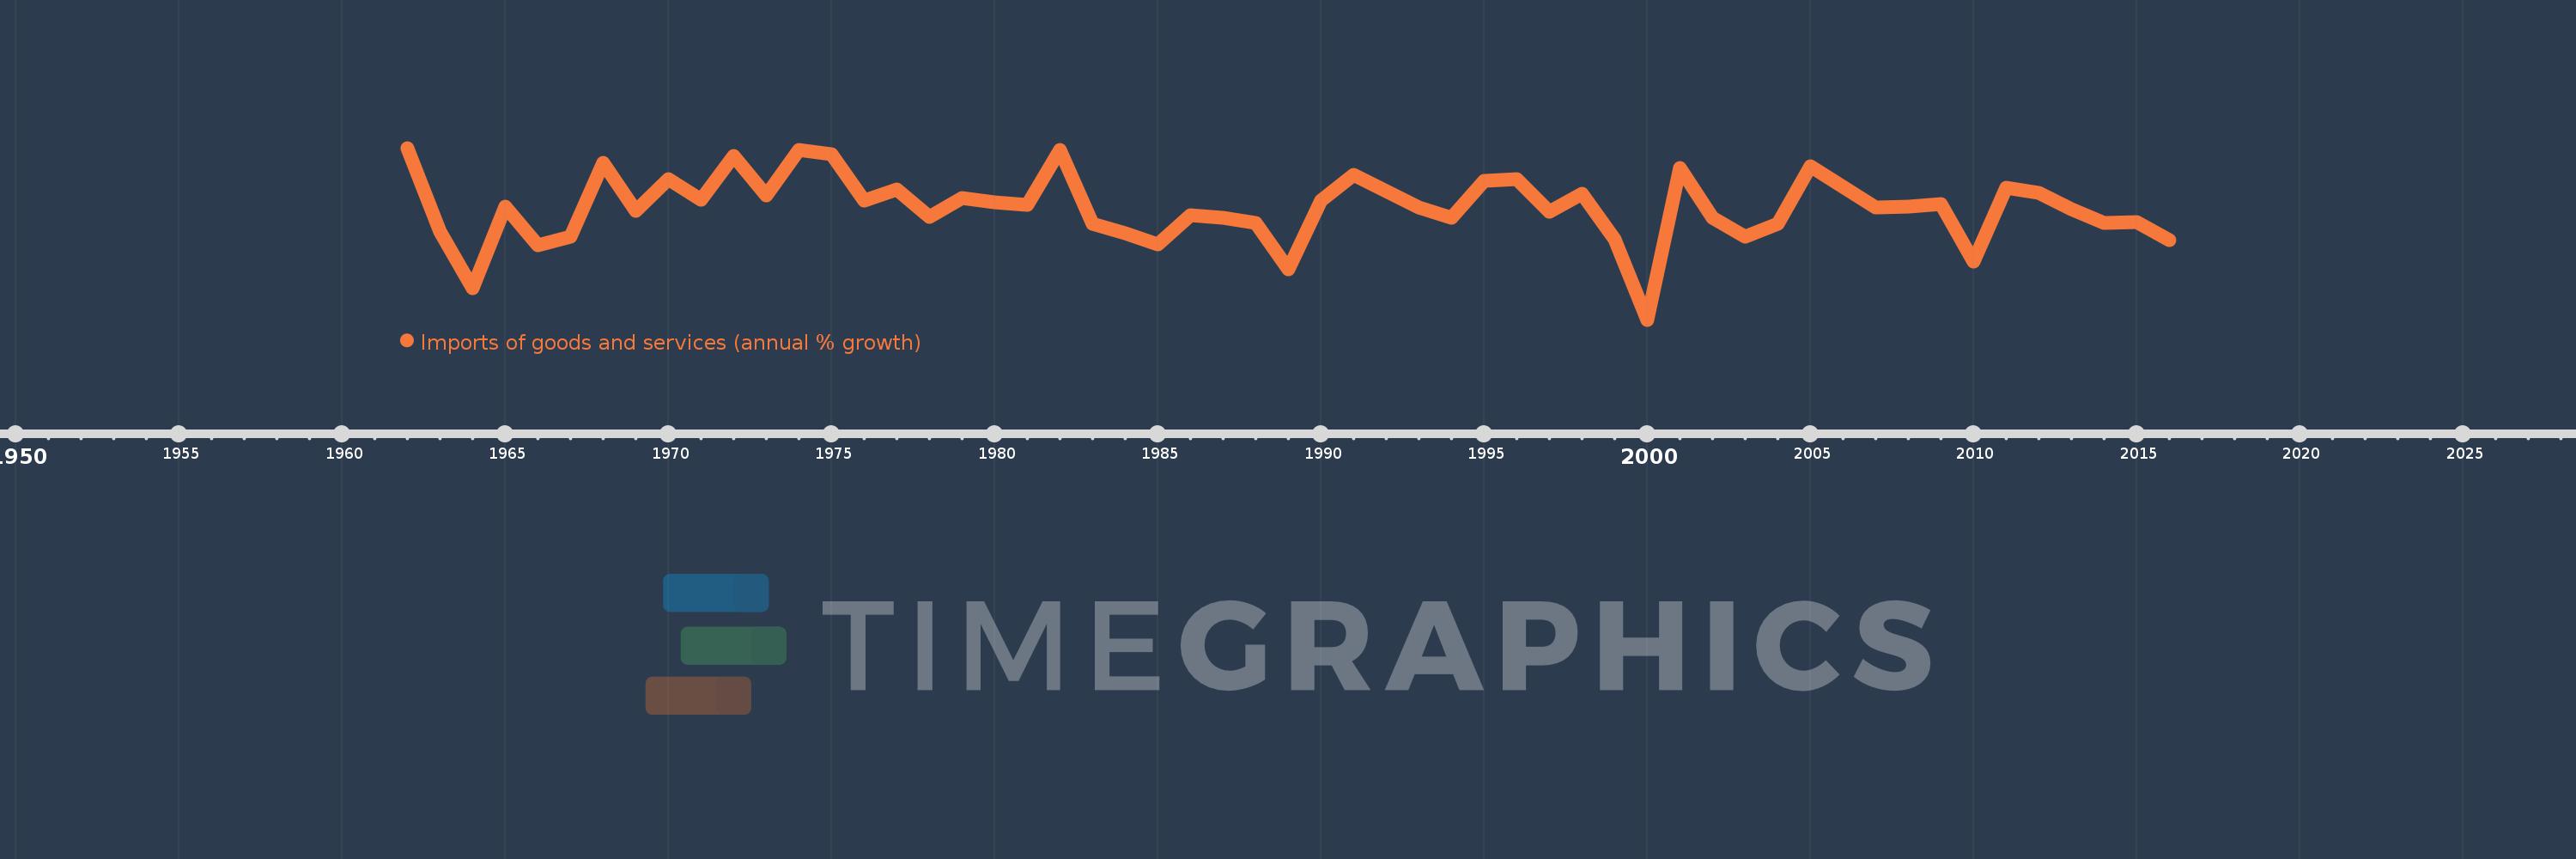
Imports of goods and services (annual % growth)
2016,2015,2014,2013,2012,2011,2010,2009,2008,2007,2006,2005,2004,2003,2002,2001,2000,1999,1998,1997,1996,1995,1994,1993,1992,1991,1990,1989,1988,1987,1986,1985,1984,1983,1982,1981,1980,1979,1978,1977,1976,1975,1974,1973,1972,1971,1970,1969,1968,1967,1966,1965,1964,1963,1962
This statistics in other country:
AlbaniaAlgeriaAngolaAntigua and BarbudaArab WorldArgentinaArmeniaAustraliaAustriaAzerbaijanBahamas, TheBahrainBangladeshBarbadosBelarusBelgiumBelizeBeninBhutanBoliviaBosnia and HerzegovinaBotswanaBrazilBrunei DarussalamBulgariaBurkina FasoBurundiCabo VerdeCambodiaCameroonCanadaCaribbean small statesCentral Europe and the BalticsChadChileColombiaComorosCongo, Dem. Rep.Congo, Rep.Costa RicaCote d'IvoireCroatiaCubaCyprusCzech RepublicDenmarkDjiboutiDominican RepublicEarly-demographic dividendEast Asia & PacificEcuadorEgypt, Arab Rep.El SalvadorEquatorial GuineaEritreaEstoniaEthiopiaEuro areaEurope & Central AsiaEurope & Central Asia (excluding high income)Europe & Central Asia (IDA & IBRD countries)European UnionFijiFinlandFranceGabonGambia, TheGeorgiaGermanyGhanaGreeceGuatemalaGuineaGuinea-BissauHaitiHeavily indebted poor countries (HIPC)High incomeHondurasHong Kong SAR, ChinaHungaryIBRD onlyIcelandIDA & IBRD totalIDA blendIDA onlyIDA totalIndiaIndonesiaIran, Islamic Rep.IrelandIsraelItalyJamaicaJapanJordanKazakhstanKenyaKorea, Rep.KosovoKuwaitKyrgyz RepublicLao PDRLatin America & Caribbean Latin America & Caribbean (excluding high income)Latin America & the Caribbean (IDA & IBRD countries)LatviaLeast developed countries: UN classificationLebanonLiberiaLibyaLithuaniaLow & middle incomeLow incomeLower middle incomeLuxembourgMacao SAR, ChinaMacedonia, FYRMadagascarMalawiMalaysiaMaliMaltaMauritaniaMauritiusMexicoMiddle East & North AfricaMiddle East & North Africa (excluding high income)Middle East & North Africa (IDA & IBRD countries)Middle incomeMoldovaMongoliaMontenegroMoroccoMozambiqueMyanmarNamibiaNepalNetherlandsNew ZealandNicaraguaNigerNigeriaNorth AmericaNorwayOECD membersOmanOther small statesPakistanPanamaPapua New GuineaParaguayPeruPhilippinesPolandPortugalPost-demographic dividendPre-demographic dividendPuerto RicoQatarRomaniaRussian FederationRwandaSamoaSaudi ArabiaSenegalSerbiaSeychellesSierra LeoneSingaporeSlovak RepublicSloveniaSmall statesSomaliaSouth AfricaSouth AsiaSouth Asia (IDA & IBRD)South SudanSpainSri LankaSub-Saharan Africa Sub-Saharan Africa (excluding high income)Sub-Saharan Africa (IDA & IBRD countries)SudanSurinameSwazilandSwedenSwitzerlandSyrian Arab RepublicTajikistanTanzaniaThailandTimor-LesteTogoTrinidad and TobagoTunisiaTurkeyTurkmenistanUgandaUkraineUnited Arab EmiratesUnited KingdomUnited StatesUruguayUzbekistanVanuatuVenezuela, RBVietnamWest Bank and GazaWorldZambiaZimbabwe Timeline:
This timeline shows a graph from 1962 to 2016 of Indonesia. No data until 1961. Number of actual observations by date: 55.
Source name:
World Development Indicators
Source organization:
World Bank national accounts data, and OECD National Accounts data files.
Categories, topics:
Economy & Growth, Trade
Last updated:
apr 23, 2017
Indicators value changes by year
Minimum:
-40.675
jan 1, 2000
Maximum:
34.805
jan 1, 1962
At the date of observation
Value
Absolute change
Change from previous value
jan 1, 1962
34.805
+34.805
0.0%
jan 1, 1963
-1.927
-36.732
-105.54%
jan 1, 1964
-26.719
-24.792
1.29K%
jan 1, 1965
8.847
+35.566
-133.11%
jan 1, 1966
-8.128
-16.975
-191.88%
jan 1, 1967
-4.29
+3.839
-47.23%
jan 1, 1968
28.291
+32.581
-759.54%
jan 1, 1969
6.987
-21.305
-75.3%
jan 1, 1970
21.021
+14.034
200.87%
jan 1, 1971
11.973
-9.048
-43.04%
jan 1, 1972
31.175
+19.202
160.38%
jan 1, 1973
14.007
-17.168
-55.07%
jan 1, 1974
34.038
+20.031
143.0%
jan 1, 1975
32.157
-1.881
-5.53%
jan 1, 1976
11.654
-20.502
-63.76%
jan 1, 1977
16.751
+5.097
43.74%
jan 1, 1978
4.448
-12.303
-73.44%
jan 1, 1979
12.651
+8.203
184.4%
jan 1, 1980
11.096
-1.555
-12.29%
jan 1, 1981
9.737
-1.359
-12.25%
jan 1, 1982
33.799
+24.062
247.12%
jan 1, 1983
1.41
-32.389
-95.83%
jan 1, 1984
-2.705
-4.115
-291.79%
jan 1, 1985
-7.511
-4.806
177.68%
jan 1, 1986
5.278
+12.789
-170.27%
jan 1, 1987
4.171
-1.107
-20.97%
jan 1, 1988
1.974
-2.197
-52.67%
jan 1, 1989
-18.695
-20.67
-1.05K%
jan 1, 1990
11.57
+30.266
-161.89%
jan 1, 1991
23.16
+11.59
100.17%
jan 1, 1992
15.727
-7.433
-32.09%
jan 1, 1993
8.691
-7.036
-44.74%
jan 1, 1994
4.175
-4.516
-51.96%
jan 1, 1995
20.295
+16.121
386.17%
jan 1, 1996
20.939
+0.644
3.17%
jan 1, 1997
6.865
-14.074
-67.22%
jan 1, 1998
14.716
+7.851
114.37%
jan 1, 1999
-5.29
-20.006
-135.95%
jan 1, 2000
-40.675
-35.385
668.89%
jan 1, 2001
25.934
+66.609
-163.76%
jan 1, 2002
4.18
-21.754
-83.88%
jan 1, 2003
-4.249
-8.429
-201.66%
jan 1, 2004
1.564
+5.813
-136.8%
jan 1, 2005
26.653
+25.09
1.6K%
jan 1, 2006
17.769
-8.884
-33.33%
jan 1, 2007
8.583
-9.186
-51.7%
jan 1, 2008
9.064
+0.482
5.61%
jan 1, 2009
10.003
+0.938
10.35%
jan 1, 2010
-14.977
-24.98
-249.74%
jan 1, 2011
17.344
+32.322
-215.8%
jan 1, 2012
15.029
-2.315
-13.35%
jan 1, 2013
7.998
-7.03
-46.78%
jan 1, 2014
1.862
-6.137
-76.72%
jan 1, 2015
2.193
+0.331
17.77%
jan 1, 2016
-5.843
-8.036
-366.44%
Ranking of countries by current statistics by years


Comments: