29
/
en
AIzaSyAYiBZKx7MnpbEhh9jyipgxe19OcubqV5w
April 1, 2024
62685
World
WLD
false
2
1
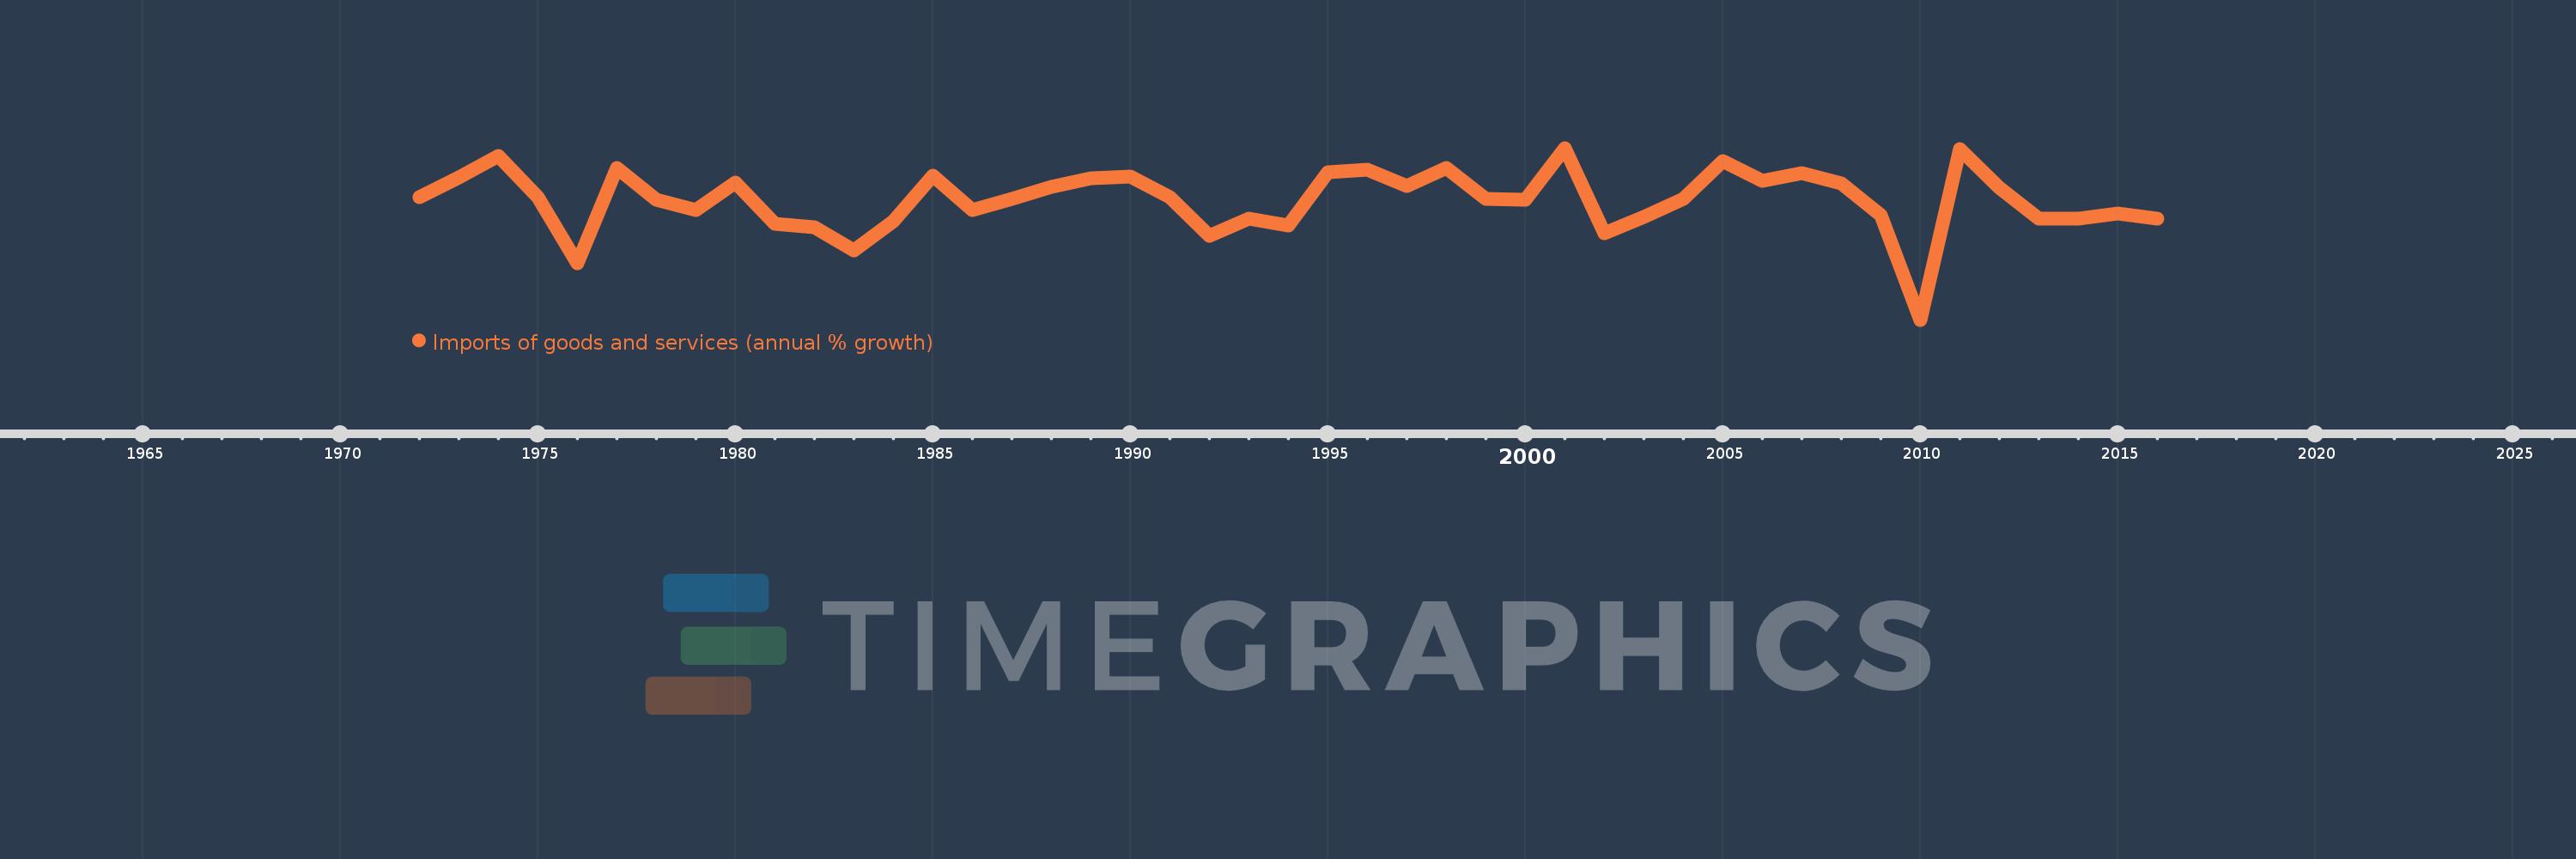
Imports of goods and services (annual % growth)
2016,2015,2014,2013,2012,2011,2010,2009,2008,2007,2006,2005,2004,2003,2002,2001,2000,1999,1998,1997,1996,1995,1994,1993,1992,1991,1990,1989,1988,1987,1986,1985,1984,1983,1982,1981,1980,1979,1978,1977,1976,1975,1974,1973,1972
This statistics in other country:
AlbaniaAlgeriaAngolaAntigua and BarbudaArab WorldArgentinaArmeniaAustraliaAustriaAzerbaijanBahamas, TheBahrainBangladeshBarbadosBelarusBelgiumBelizeBeninBhutanBoliviaBosnia and HerzegovinaBotswanaBrazilBrunei DarussalamBulgariaBurkina FasoBurundiCabo VerdeCambodiaCameroonCanadaCaribbean small statesCentral Europe and the BalticsChadChileColombiaComorosCongo, Dem. Rep.Congo, Rep.Costa RicaCote d'IvoireCroatiaCubaCyprusCzech RepublicDenmarkDjiboutiDominican RepublicEarly-demographic dividendEast Asia & PacificEcuadorEgypt, Arab Rep.El SalvadorEquatorial GuineaEritreaEstoniaEthiopiaEuro areaEurope & Central AsiaEurope & Central Asia (excluding high income)Europe & Central Asia (IDA & IBRD countries)European UnionFijiFinlandFranceGabonGambia, TheGeorgiaGermanyGhanaGreeceGuatemalaGuineaGuinea-BissauHaitiHeavily indebted poor countries (HIPC)High incomeHondurasHong Kong SAR, ChinaHungaryIBRD onlyIcelandIDA & IBRD totalIDA blendIDA onlyIDA totalIndiaIndonesiaIran, Islamic Rep.IrelandIsraelItalyJamaicaJapanJordanKazakhstanKenyaKorea, Rep.KosovoKuwaitKyrgyz RepublicLao PDRLatin America & Caribbean Latin America & Caribbean (excluding high income)Latin America & the Caribbean (IDA & IBRD countries)LatviaLeast developed countries: UN classificationLebanonLiberiaLibyaLithuaniaLow & middle incomeLow incomeLower middle incomeLuxembourgMacao SAR, ChinaMacedonia, FYRMadagascarMalawiMalaysiaMaliMaltaMauritaniaMauritiusMexicoMiddle East & North AfricaMiddle East & North Africa (excluding high income)Middle East & North Africa (IDA & IBRD countries)Middle incomeMoldovaMongoliaMontenegroMoroccoMozambiqueMyanmarNamibiaNepalNetherlandsNew ZealandNicaraguaNigerNigeriaNorth AmericaNorwayOECD membersOmanOther small statesPakistanPanamaPapua New GuineaParaguayPeruPhilippinesPolandPortugalPost-demographic dividendPre-demographic dividendPuerto RicoQatarRomaniaRussian FederationRwandaSamoaSaudi ArabiaSenegalSerbiaSeychellesSierra LeoneSingaporeSlovak RepublicSloveniaSmall statesSomaliaSouth AfricaSouth AsiaSouth Asia (IDA & IBRD)South SudanSpainSri LankaSub-Saharan Africa Sub-Saharan Africa (excluding high income)Sub-Saharan Africa (IDA & IBRD countries)SudanSurinameSwazilandSwedenSwitzerlandSyrian Arab RepublicTajikistanTanzaniaThailandTimor-LesteTogoTrinidad and TobagoTunisiaTurkeyTurkmenistanUgandaUkraineUnited Arab EmiratesUnited KingdomUnited StatesUruguayUzbekistanVanuatuVenezuela, RBVietnamWest Bank and GazaWorldZambiaZimbabwe Timeline:
This timeline shows a graph from 1972 to 2016 of World. No data until 1971. Number of actual observations by date: 45.
Source name:
World Development Indicators
Source organization:
World Bank national accounts data, and OECD National Accounts data files.
Categories, topics:
Economy & Growth, Trade
Last updated:
apr 23, 2017
Indicators value changes by year
Minimum:
-11.96
jan 1, 2010
Maximum:
12.528
jan 1, 2001
At the date of observation
Value
Absolute change
Change from previous value
jan 1, 1972
5.467
+5.467
0.0%
jan 1, 1973
8.35
+2.883
52.73%
jan 1, 1974
11.353
+3.003
35.97%
jan 1, 1975
5.495
-5.859
-51.6%
jan 1, 1976
-3.891
-9.386
-170.81%
jan 1, 1977
9.656
+13.547
-348.17%
jan 1, 1978
5.181
-4.475
-46.34%
jan 1, 1979
3.624
-1.557
-30.05%
jan 1, 1980
7.537
+3.913
107.96%
jan 1, 1981
1.765
-5.772
-76.59%
jan 1, 1982
1.2
-0.565
-32.02%
jan 1, 1983
-2.063
-3.262
-271.98%
jan 1, 1984
2.049
+4.112
-199.33%
jan 1, 1985
8.558
+6.509
317.66%
jan 1, 1986
3.679
-4.879
-57.01%
jan 1, 1987
5.227
+1.547
42.06%
jan 1, 1988
6.976
+1.749
33.46%
jan 1, 1989
8.185
+1.209
17.33%
jan 1, 1990
8.4
+0.215
2.63%
jan 1, 1991
5.495
-2.905
-34.58%
jan 1, 1992
0.045
-5.45
-99.19%
jan 1, 1993
2.501
+2.456
5.49K%
jan 1, 1994
1.507
-0.994
-39.75%
jan 1, 1995
9.108
+7.601
504.51%
jan 1, 1996
9.424
+0.316
3.47%
jan 1, 1997
7.11
-2.314
-24.55%
jan 1, 1998
9.703
+2.593
36.46%
jan 1, 1999
5.255
-4.448
-45.84%
jan 1, 2000
5.198
-0.058
-1.1%
jan 1, 2001
12.528
+7.33
141.02%
jan 1, 2002
0.315
-12.213
-97.49%
jan 1, 2003
2.752
+2.437
773.86%
jan 1, 2004
5.269
+2.516
91.43%
jan 1, 2005
10.647
+5.379
102.09%
jan 1, 2006
7.876
-2.771
-26.02%
jan 1, 2007
8.891
+1.015
12.88%
jan 1, 2008
7.523
-1.367
-15.38%
jan 1, 2009
2.91
-4.613
-61.32%
jan 1, 2010
-11.96
-14.87
-511.01%
jan 1, 2011
12.371
+24.331
-203.44%
jan 1, 2012
6.814
-5.557
-44.92%
jan 1, 2013
2.456
-4.358
-63.96%
jan 1, 2014
2.432
-0.024
-0.98%
jan 1, 2015
3.206
+0.775
31.87%
jan 1, 2016
2.483
-0.723
-22.56%
Ranking of countries by current statistics by years


Comments: