29
/
en
AIzaSyAYiBZKx7MnpbEhh9jyipgxe19OcubqV5w
April 1, 2024
123618
Ecuador
ECU
true
2
1
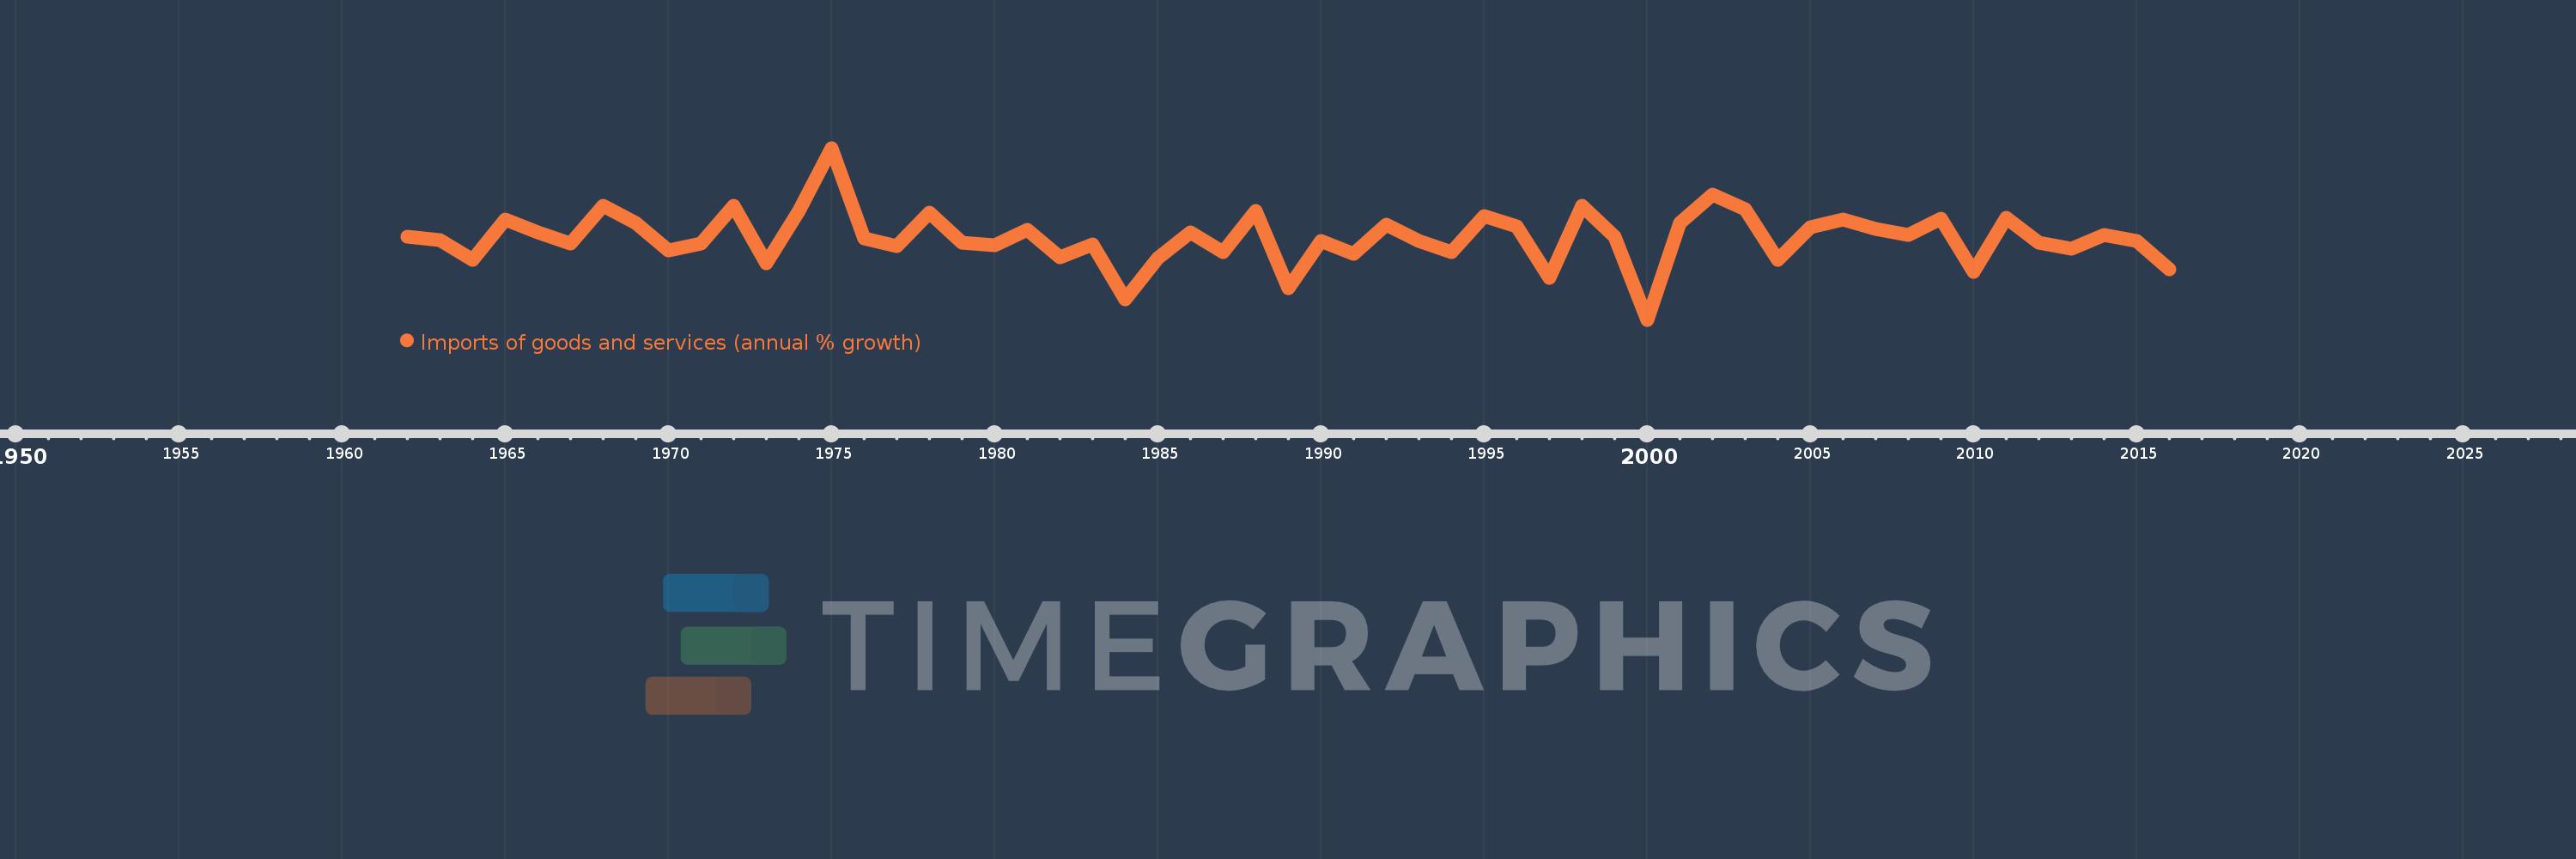
Imports of goods and services (annual % growth)
2016,2015,2014,2013,2012,2011,2010,2009,2008,2007,2006,2005,2004,2003,2002,2001,2000,1999,1998,1997,1996,1995,1994,1993,1992,1991,1990,1989,1988,1987,1986,1985,1984,1983,1982,1981,1980,1979,1978,1977,1976,1975,1974,1973,1972,1971,1970,1969,1968,1967,1966,1965,1964,1963,1962
This statistics in other country:
AlbaniaAlgeriaAngolaAntigua and BarbudaArab WorldArgentinaArmeniaAustraliaAustriaAzerbaijanBahamas, TheBahrainBangladeshBarbadosBelarusBelgiumBelizeBeninBhutanBoliviaBosnia and HerzegovinaBotswanaBrazilBrunei DarussalamBulgariaBurkina FasoBurundiCabo VerdeCambodiaCameroonCanadaCaribbean small statesCentral Europe and the BalticsChadChileColombiaComorosCongo, Dem. Rep.Congo, Rep.Costa RicaCote d'IvoireCroatiaCubaCyprusCzech RepublicDenmarkDjiboutiDominican RepublicEarly-demographic dividendEast Asia & PacificEcuadorEgypt, Arab Rep.El SalvadorEquatorial GuineaEritreaEstoniaEthiopiaEuro areaEurope & Central AsiaEurope & Central Asia (excluding high income)Europe & Central Asia (IDA & IBRD countries)European UnionFijiFinlandFranceGabonGambia, TheGeorgiaGermanyGhanaGreeceGuatemalaGuineaGuinea-BissauHaitiHeavily indebted poor countries (HIPC)High incomeHondurasHong Kong SAR, ChinaHungaryIBRD onlyIcelandIDA & IBRD totalIDA blendIDA onlyIDA totalIndiaIndonesiaIran, Islamic Rep.IrelandIsraelItalyJamaicaJapanJordanKazakhstanKenyaKorea, Rep.KosovoKuwaitKyrgyz RepublicLao PDRLatin America & Caribbean Latin America & Caribbean (excluding high income)Latin America & the Caribbean (IDA & IBRD countries)LatviaLeast developed countries: UN classificationLebanonLiberiaLibyaLithuaniaLow & middle incomeLow incomeLower middle incomeLuxembourgMacao SAR, ChinaMacedonia, FYRMadagascarMalawiMalaysiaMaliMaltaMauritaniaMauritiusMexicoMiddle East & North AfricaMiddle East & North Africa (excluding high income)Middle East & North Africa (IDA & IBRD countries)Middle incomeMoldovaMongoliaMontenegroMoroccoMozambiqueMyanmarNamibiaNepalNetherlandsNew ZealandNicaraguaNigerNigeriaNorth AmericaNorwayOECD membersOmanOther small statesPakistanPanamaPapua New GuineaParaguayPeruPhilippinesPolandPortugalPost-demographic dividendPre-demographic dividendPuerto RicoQatarRomaniaRussian FederationRwandaSamoaSaudi ArabiaSenegalSerbiaSeychellesSierra LeoneSingaporeSlovak RepublicSloveniaSmall statesSomaliaSouth AfricaSouth AsiaSouth Asia (IDA & IBRD)South SudanSpainSri LankaSub-Saharan Africa Sub-Saharan Africa (excluding high income)Sub-Saharan Africa (IDA & IBRD countries)SudanSurinameSwazilandSwedenSwitzerlandSyrian Arab RepublicTajikistanTanzaniaThailandTimor-LesteTogoTrinidad and TobagoTunisiaTurkeyTurkmenistanUgandaUkraineUnited Arab EmiratesUnited KingdomUnited StatesUruguayUzbekistanVanuatuVenezuela, RBVietnamWest Bank and GazaWorldZambiaZimbabwe Timeline:
This timeline shows a graph from 1962 to 2016 of Ecuador. No data until 1961. Number of actual observations by date: 55.
Source name:
World Development Indicators
Source organization:
World Bank national accounts data, and OECD National Accounts data files.
Categories, topics:
Economy & Growth, Trade
Last updated:
apr 23, 2017
Indicators value changes by year
Minimum:
-31.595
jan 1, 2000
Maximum:
46.931
jan 1, 1975
At the date of observation
Value
Absolute change
Change from previous value
jan 1, 1962
6.479
+6.479
0.0%
jan 1, 1963
4.762
-1.717
-26.5%
jan 1, 1964
-4.293
-9.055
-190.15%
jan 1, 1965
14.248
+18.541
-431.9%
jan 1, 1966
8.366
-5.882
-41.28%
jan 1, 1967
3.237
-5.129
-61.31%
jan 1, 1968
20.545
+17.308
534.71%
jan 1, 1969
12.475
-8.071
-39.28%
jan 1, 1970
0.023
-12.452
-99.81%
jan 1, 1971
3.215
+3.192
13.81K%
jan 1, 1972
20.388
+17.173
534.18%
jan 1, 1973
-5.723
-26.111
-128.07%
jan 1, 1974
18.267
+23.99
-419.16%
jan 1, 1975
46.931
+28.665
156.92%
jan 1, 1976
5.51
-41.421
-88.26%
jan 1, 1977
1.989
-3.521
-63.91%
jan 1, 1978
17.305
+15.316
770.19%
jan 1, 1979
3.776
-13.529
-78.18%
jan 1, 1980
2.345
-1.43
-37.89%
jan 1, 1981
9.434
+7.089
302.27%
jan 1, 1982
-3.122
-12.556
-133.09%
jan 1, 1983
2.804
+5.926
-189.82%
jan 1, 1984
-22.321
-25.125
-895.97%
jan 1, 1985
-3.595
+18.726
-83.89%
jan 1, 1986
8.515
+12.11
-336.87%
jan 1, 1987
-0.504
-9.02
-105.92%
jan 1, 1988
17.968
+18.472
-3.66K%
jan 1, 1989
-17.193
-35.161
-195.69%
jan 1, 1990
4.564
+21.757
-126.55%
jan 1, 1991
-1.555
-6.119
-134.08%
jan 1, 1992
11.788
+13.344
-857.96%
jan 1, 1993
4.486
-7.303
-61.95%
jan 1, 1994
-0.551
-5.037
-112.28%
jan 1, 1995
15.976
+16.527
-3.0K%
jan 1, 1996
11.23
-4.746
-29.71%
jan 1, 1997
-12.597
-23.827
-212.17%
jan 1, 1998
20.513
+33.11
-262.84%
jan 1, 1999
6.532
-13.981
-68.16%
jan 1, 2000
-31.595
-38.127
-583.72%
jan 1, 2001
12.822
+44.417
-140.58%
jan 1, 2002
25.722
+12.901
100.62%
jan 1, 2003
19.015
-6.707
-26.08%
jan 1, 2004
-4.06
-23.075
-121.35%
jan 1, 2005
10.877
+14.937
-367.92%
jan 1, 2006
14.395
+3.518
32.35%
jan 1, 2007
9.774
-4.622
-32.11%
jan 1, 2008
7.055
-2.719
-27.82%
jan 1, 2009
14.439
+7.384
104.67%
jan 1, 2010
-9.919
-24.358
-168.7%
jan 1, 2011
14.824
+24.743
-249.45%
jan 1, 2012
3.646
-11.178
-75.4%
jan 1, 2013
0.835
-2.812
-77.1%
jan 1, 2014
6.966
+6.131
734.39%
jan 1, 2015
4.314
-2.652
-38.07%
jan 1, 2016
-8.581
-12.895
-298.93%
Ranking of countries by current statistics by years


Comments: