29
/
en
AIzaSyAYiBZKx7MnpbEhh9jyipgxe19OcubqV5w
April 1, 2024
35824
High income
HIC
false
2
1
Imports of goods and services (annual % growth)
2016,2015,2014,2013,2012,2011,2010,2009,2008,2007,2006,2005,2004,2003,2002,2001,2000,1999,1998,1997,1996,1995,1994,1993,1992,1991,1990,1989,1988,1987,1986,1985,1984,1983,1982,1981,1980,1979,1978,1977,1976,1975,1974,1973,1972
This statistics in other country:
AlbaniaAlgeriaAngolaAntigua and BarbudaArab WorldArgentinaArmeniaAustraliaAustriaAzerbaijanBahamas, TheBahrainBangladeshBarbadosBelarusBelgiumBelizeBeninBhutanBoliviaBosnia and HerzegovinaBotswanaBrazilBrunei DarussalamBulgariaBurkina FasoBurundiCabo VerdeCambodiaCameroonCanadaCaribbean small statesCentral Europe and the BalticsChadChileColombiaComorosCongo, Dem. Rep.Congo, Rep.Costa RicaCote d'IvoireCroatiaCubaCyprusCzech RepublicDenmarkDjiboutiDominican RepublicEarly-demographic dividendEast Asia & PacificEcuadorEgypt, Arab Rep.El SalvadorEquatorial GuineaEritreaEstoniaEthiopiaEuro areaEurope & Central AsiaEurope & Central Asia (excluding high income)Europe & Central Asia (IDA & IBRD countries)European UnionFijiFinlandFranceGabonGambia, TheGeorgiaGermanyGhanaGreeceGuatemalaGuineaGuinea-BissauHaitiHeavily indebted poor countries (HIPC)High incomeHondurasHong Kong SAR, ChinaHungaryIBRD onlyIcelandIDA & IBRD totalIDA blendIDA onlyIDA totalIndiaIndonesiaIran, Islamic Rep.IrelandIsraelItalyJamaicaJapanJordanKazakhstanKenyaKorea, Rep.KosovoKuwaitKyrgyz RepublicLao PDRLatin America & Caribbean Latin America & Caribbean (excluding high income)Latin America & the Caribbean (IDA & IBRD countries)LatviaLeast developed countries: UN classificationLebanonLiberiaLibyaLithuaniaLow & middle incomeLow incomeLower middle incomeLuxembourgMacao SAR, ChinaMacedonia, FYRMadagascarMalawiMalaysiaMaliMaltaMauritaniaMauritiusMexicoMiddle East & North AfricaMiddle East & North Africa (excluding high income)Middle East & North Africa (IDA & IBRD countries)Middle incomeMoldovaMongoliaMontenegroMoroccoMozambiqueMyanmarNamibiaNepalNetherlandsNew ZealandNicaraguaNigerNigeriaNorth AmericaNorwayOECD membersOmanOther small statesPakistanPanamaPapua New GuineaParaguayPeruPhilippinesPolandPortugalPost-demographic dividendPre-demographic dividendPuerto RicoQatarRomaniaRussian FederationRwandaSamoaSaudi ArabiaSenegalSerbiaSeychellesSierra LeoneSingaporeSlovak RepublicSloveniaSmall statesSomaliaSouth AfricaSouth AsiaSouth Asia (IDA & IBRD)South SudanSpainSri LankaSub-Saharan Africa Sub-Saharan Africa (excluding high income)Sub-Saharan Africa (IDA & IBRD countries)SudanSurinameSwazilandSwedenSwitzerlandSyrian Arab RepublicTajikistanTanzaniaThailandTimor-LesteTogoTrinidad and TobagoTunisiaTurkeyTurkmenistanUgandaUkraineUnited Arab EmiratesUnited KingdomUnited StatesUruguayUzbekistanVanuatuVenezuela, RBVietnamWest Bank and GazaWorldZambiaZimbabwe Timeline:
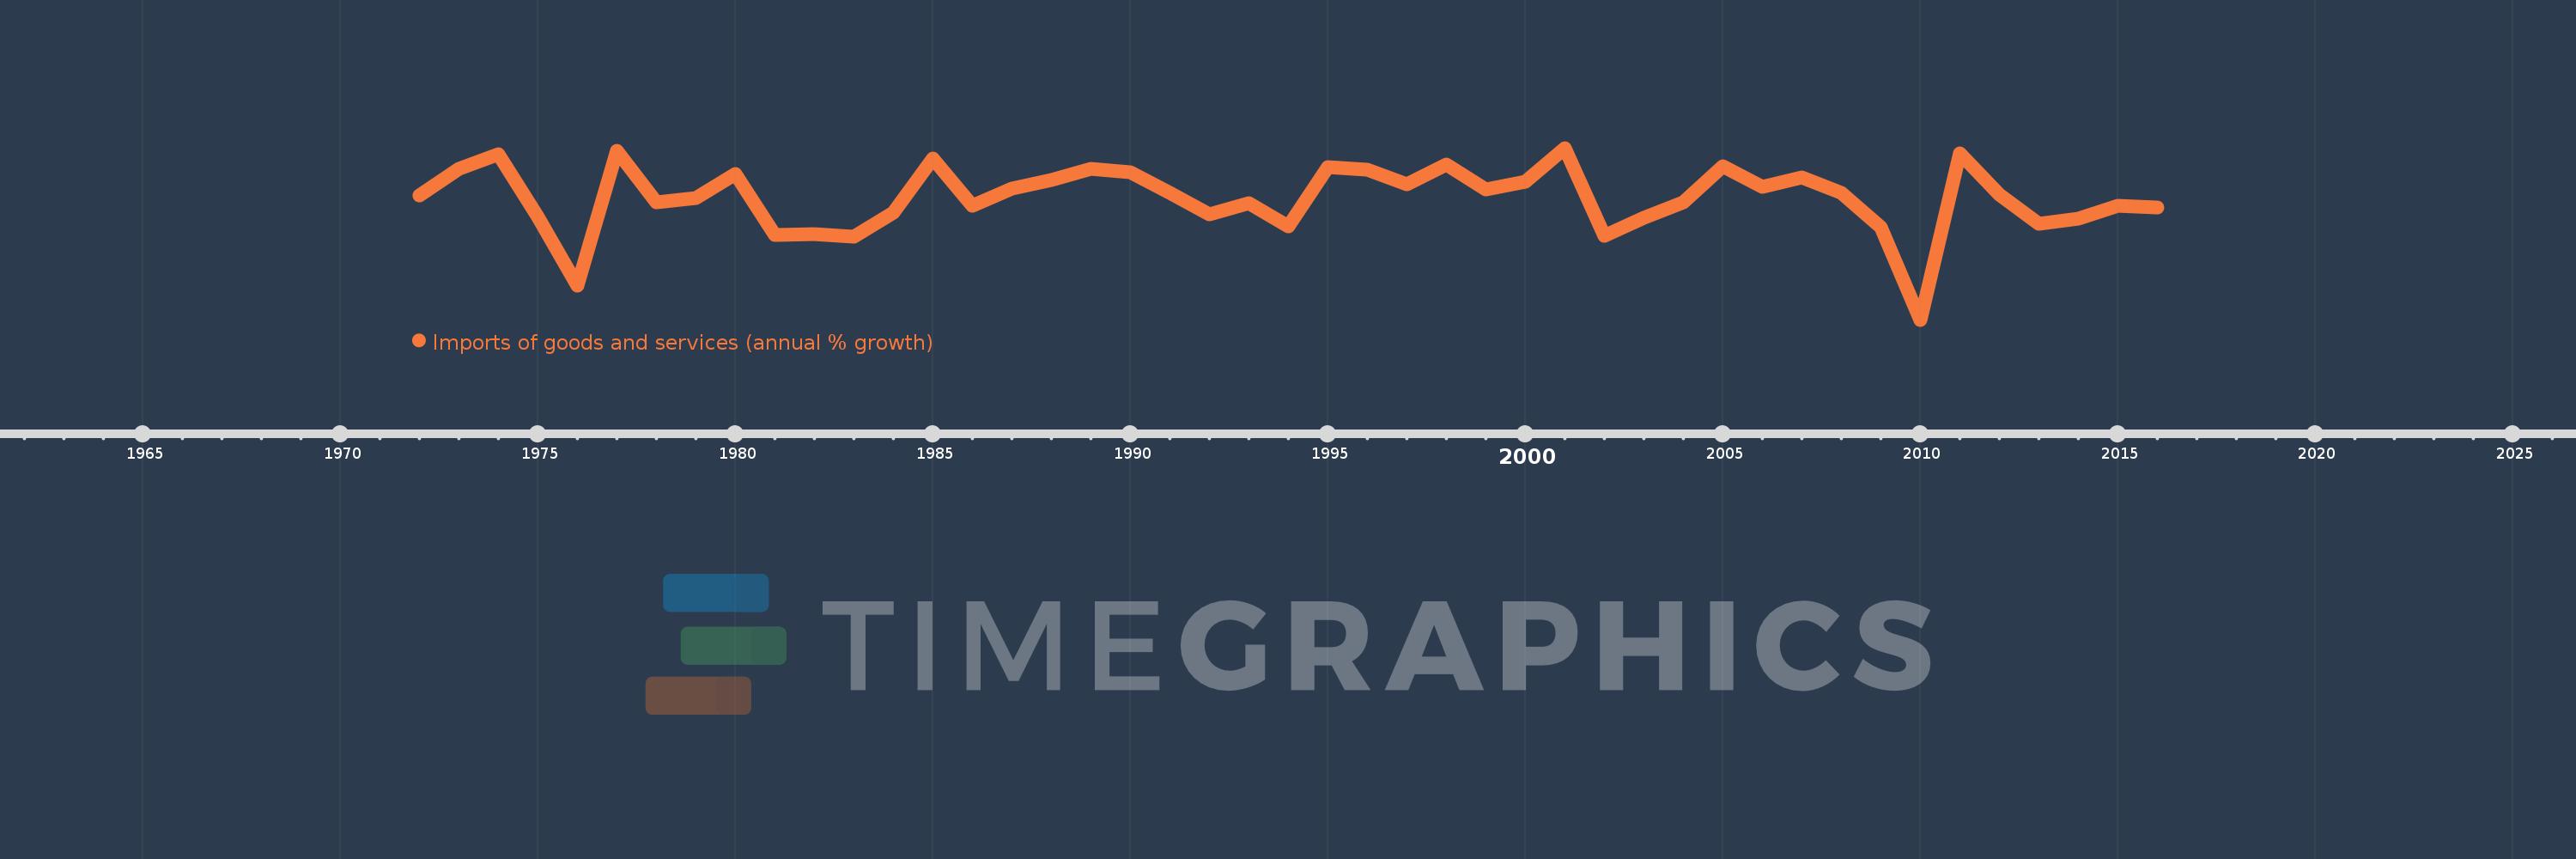
This timeline shows a graph from 1972 to 2016 of High income. No data until 1971. Number of actual observations by date: 45.
Source name:
World Development Indicators
Source organization:
World Bank national accounts data, and OECD National Accounts data files.
Categories, topics:
Economy & Growth, Trade
Last updated:
apr 23, 2017
Indicators value changes by year
Minimum:
-11.614
jan 1, 2010
Maximum:
12.139
jan 1, 2001
At the date of observation
Value
Absolute change
Change from previous value
jan 1, 1972
5.567
+5.567
0.0%
jan 1, 1973
9.269
+3.702
66.5%
jan 1, 1974
11.229
+1.96
21.14%
jan 1, 1975
2.56
-8.668
-77.2%
jan 1, 1976
-6.866
-9.427
-368.19%
jan 1, 1977
11.743
+18.609
-271.02%
jan 1, 1978
4.669
-7.074
-60.24%
jan 1, 1979
5.228
+0.559
11.97%
jan 1, 1980
8.558
+3.33
63.71%
jan 1, 1981
0.098
-8.46
-98.86%
jan 1, 1982
0.241
+0.143
146.11%
jan 1, 1983
-0.154
-0.396
-164.03%
jan 1, 1984
3.189
+3.344
-2.17K%
jan 1, 1985
10.695
+7.505
235.33%
jan 1, 1986
4.174
-6.52
-60.97%
jan 1, 1987
6.557
+2.383
57.08%
jan 1, 1988
7.729
+1.172
17.87%
jan 1, 1989
9.303
+1.574
20.36%
jan 1, 1990
8.833
-0.47
-5.05%
jan 1, 1991
5.938
-2.895
-32.78%
jan 1, 1992
2.998
-2.94
-49.51%
jan 1, 1993
4.503
+1.505
50.21%
jan 1, 1994
1.336
-3.167
-70.33%
jan 1, 1995
9.542
+8.206
614.19%
jan 1, 1996
9.183
-0.359
-3.76%
jan 1, 1997
7.125
-2.058
-22.41%
jan 1, 1998
9.824
+2.699
37.88%
jan 1, 1999
6.409
-3.415
-34.76%
jan 1, 2000
7.446
+1.037
16.18%
jan 1, 2001
12.139
+4.693
63.02%
jan 1, 2002
-0.034
-12.173
-100.28%
jan 1, 2003
2.534
+2.569
-7.52K%
jan 1, 2004
4.57
+2.036
80.33%
jan 1, 2005
9.562
+4.992
109.24%
jan 1, 2006
6.749
-2.813
-29.42%
jan 1, 2007
8.112
+1.363
20.2%
jan 1, 2008
5.93
-2.182
-26.9%
jan 1, 2009
1.221
-4.709
-79.41%
jan 1, 2010
-11.614
-12.835
-1.05K%
jan 1, 2011
11.371
+22.985
-197.91%
jan 1, 2012
5.656
-5.715
-50.26%
jan 1, 2013
1.618
-4.038
-71.39%
jan 1, 2014
2.409
+0.791
48.85%
jan 1, 2015
4.097
+1.688
70.08%
jan 1, 2016
3.935
-0.162
-3.96%
Ranking of countries by current statistics by years


Comments: