29
/
en
AIzaSyAYiBZKx7MnpbEhh9jyipgxe19OcubqV5w
April 1, 2024
108633
Comoros
COM
true
2
1
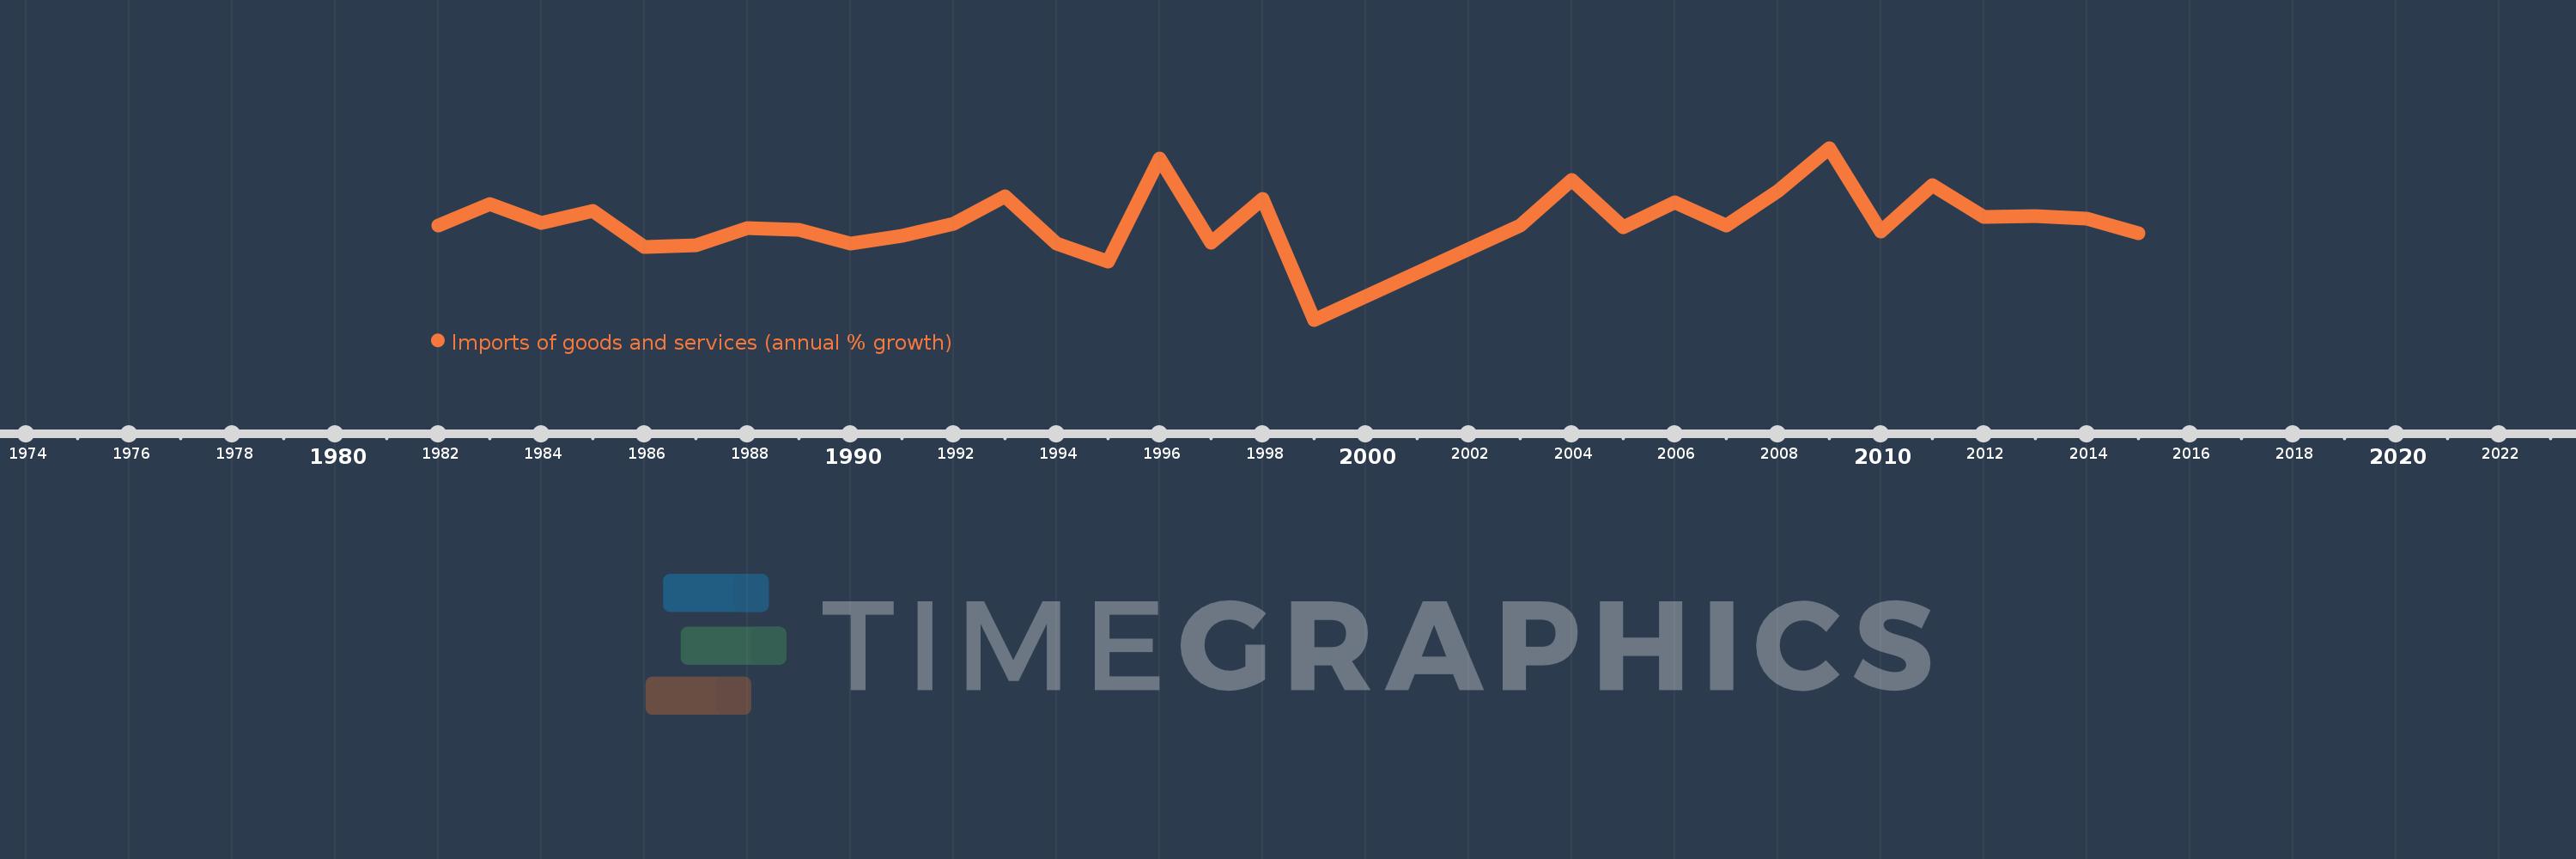
Imports of goods and services (annual % growth)
2015,2014,2013,2012,2011,2010,2009,2008,2007,2006,2005,2004,2003,1999,1998,1997,1996,1995,1994,1993,1992,1991,1990,1989,1988,1987,1986,1985,1984,1983,1982
This statistics in other country:
AlbaniaAlgeriaAngolaAntigua and BarbudaArab WorldArgentinaArmeniaAustraliaAustriaAzerbaijanBahamas, TheBahrainBangladeshBarbadosBelarusBelgiumBelizeBeninBhutanBoliviaBosnia and HerzegovinaBotswanaBrazilBrunei DarussalamBulgariaBurkina FasoBurundiCabo VerdeCambodiaCameroonCanadaCaribbean small statesCentral Europe and the BalticsChadChileColombiaComorosCongo, Dem. Rep.Congo, Rep.Costa RicaCote d'IvoireCroatiaCubaCyprusCzech RepublicDenmarkDjiboutiDominican RepublicEarly-demographic dividendEast Asia & PacificEcuadorEgypt, Arab Rep.El SalvadorEquatorial GuineaEritreaEstoniaEthiopiaEuro areaEurope & Central AsiaEurope & Central Asia (excluding high income)Europe & Central Asia (IDA & IBRD countries)European UnionFijiFinlandFranceGabonGambia, TheGeorgiaGermanyGhanaGreeceGuatemalaGuineaGuinea-BissauHaitiHeavily indebted poor countries (HIPC)High incomeHondurasHong Kong SAR, ChinaHungaryIBRD onlyIcelandIDA & IBRD totalIDA blendIDA onlyIDA totalIndiaIndonesiaIran, Islamic Rep.IrelandIsraelItalyJamaicaJapanJordanKazakhstanKenyaKorea, Rep.KosovoKuwaitKyrgyz RepublicLao PDRLatin America & Caribbean Latin America & Caribbean (excluding high income)Latin America & the Caribbean (IDA & IBRD countries)LatviaLeast developed countries: UN classificationLebanonLiberiaLibyaLithuaniaLow & middle incomeLow incomeLower middle incomeLuxembourgMacao SAR, ChinaMacedonia, FYRMadagascarMalawiMalaysiaMaliMaltaMauritaniaMauritiusMexicoMiddle East & North AfricaMiddle East & North Africa (excluding high income)Middle East & North Africa (IDA & IBRD countries)Middle incomeMoldovaMongoliaMontenegroMoroccoMozambiqueMyanmarNamibiaNepalNetherlandsNew ZealandNicaraguaNigerNigeriaNorth AmericaNorwayOECD membersOmanOther small statesPakistanPanamaPapua New GuineaParaguayPeruPhilippinesPolandPortugalPost-demographic dividendPre-demographic dividendPuerto RicoQatarRomaniaRussian FederationRwandaSamoaSaudi ArabiaSenegalSerbiaSeychellesSierra LeoneSingaporeSlovak RepublicSloveniaSmall statesSomaliaSouth AfricaSouth AsiaSouth Asia (IDA & IBRD)South SudanSpainSri LankaSub-Saharan Africa Sub-Saharan Africa (excluding high income)Sub-Saharan Africa (IDA & IBRD countries)SudanSurinameSwazilandSwedenSwitzerlandSyrian Arab RepublicTajikistanTanzaniaThailandTimor-LesteTogoTrinidad and TobagoTunisiaTurkeyTurkmenistanUgandaUkraineUnited Arab EmiratesUnited KingdomUnited StatesUruguayUzbekistanVanuatuVenezuela, RBVietnamWest Bank and GazaWorldZambiaZimbabwe Timeline:
This timeline shows a graph from 1982 to 2015 of Comoros. No data until 1981. Number of actual observations by date: 31.
Source name:
World Development Indicators
Source organization:
World Bank national accounts data, and OECD National Accounts data files.
Categories, topics:
Economy & Growth, Trade
Last updated:
apr 23, 2017
Indicators value changes by year
Minimum:
-38.771
jan 1, 1999
Maximum:
35.398
jan 1, 2009
At the date of observation
Value
Absolute change
Change from previous value
jan 1, 1982
1.874
+1.874
0.0%
jan 1, 1983
11.236
+9.362
499.47%
jan 1, 1984
3.198
-8.038
-71.54%
jan 1, 1985
8.35
+5.152
161.09%
jan 1, 1986
-7.371
-15.721
-188.27%
jan 1, 1987
-6.62
+0.751
-10.18%
jan 1, 1988
0.795
+7.415
-112.0%
jan 1, 1989
0.087
-0.707
-89.03%
jan 1, 1990
-5.819
-5.906
-6.77K%
jan 1, 1991
-2.54
+3.279
-56.35%
jan 1, 1992
2.604
+5.144
-202.54%
jan 1, 1993
14.426
+11.821
453.91%
jan 1, 1994
-5.972
-20.398
-141.4%
jan 1, 1995
-13.762
-7.79
130.44%
jan 1, 1996
30.806
+44.568
-323.86%
jan 1, 1997
-5.457
-36.263
-117.71%
jan 1, 1998
13.247
+18.704
-342.78%
jan 1, 1999
-38.771
-52.018
-392.67%
jan 1, 2003
1.906
+40.677
-104.92%
jan 1, 2004
21.479
+19.573
1.03K%
jan 1, 2005
1.093
-20.386
-94.91%
jan 1, 2006
12.053
+10.961
1.0K%
jan 1, 2007
1.727
-10.326
-85.67%
jan 1, 2008
16.716
+14.989
867.67%
jan 1, 2009
35.398
+18.682
111.76%
jan 1, 2010
-0.506
-35.905
-101.43%
jan 1, 2011
19.307
+19.814
-3.91K%
jan 1, 2012
5.456
-13.852
-71.74%
jan 1, 2013
5.847
+0.391
7.17%
jan 1, 2014
4.961
-0.886
-15.16%
jan 1, 2015
-1.4
-6.361
-128.22%
Ranking of countries by current statistics by years


Comments: