29
/
en
AIzaSyAYiBZKx7MnpbEhh9jyipgxe19OcubqV5w
April 1, 2024
31681
Europe & Central Asia (excluding high income)
ECA
false
2
1
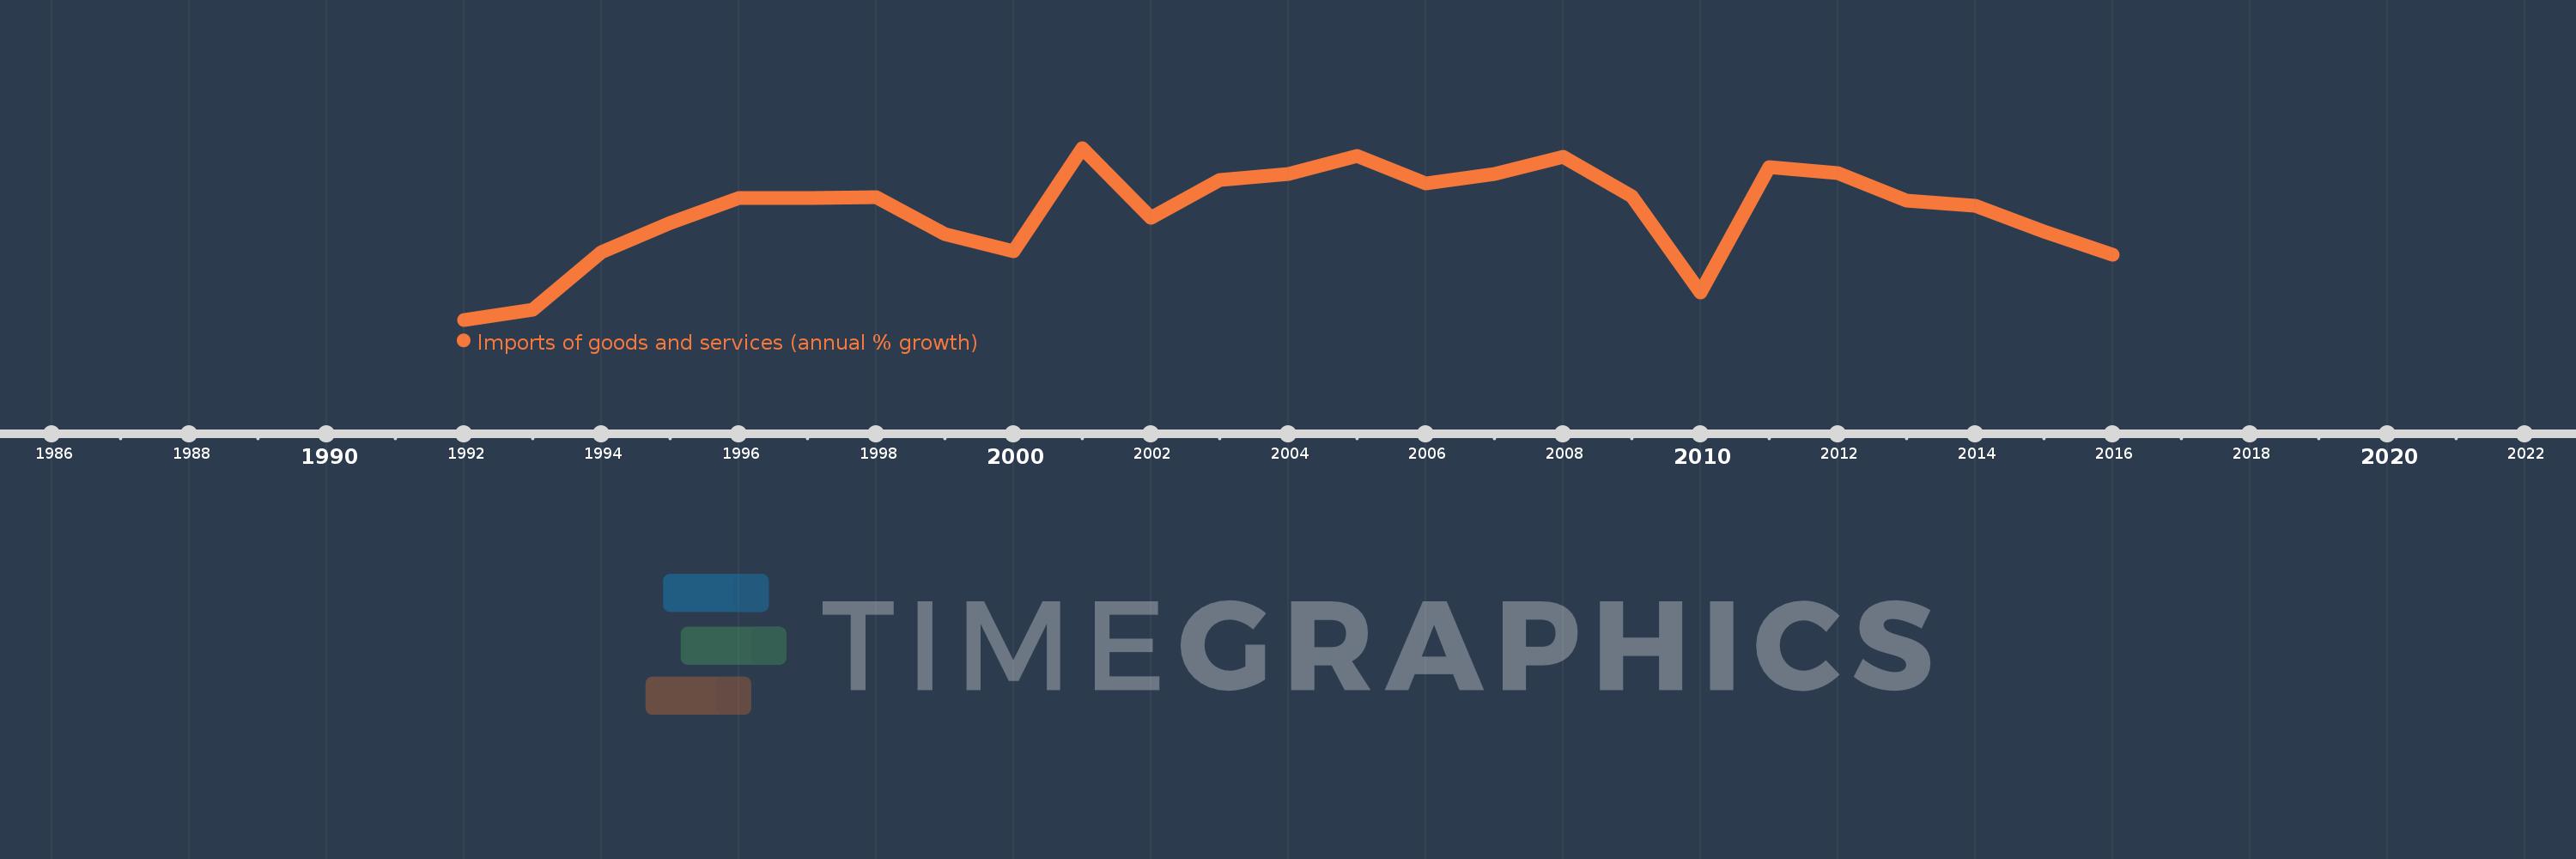
Imports of goods and services (annual % growth)
2016,2015,2014,2013,2012,2011,2010,2009,2008,2007,2006,2005,2004,2003,2002,2001,2000,1999,1998,1997,1996,1995,1994,1993,1992
This statistics in other country:
AlbaniaAlgeriaAngolaAntigua and BarbudaArab WorldArgentinaArmeniaAustraliaAustriaAzerbaijanBahamas, TheBahrainBangladeshBarbadosBelarusBelgiumBelizeBeninBhutanBoliviaBosnia and HerzegovinaBotswanaBrazilBrunei DarussalamBulgariaBurkina FasoBurundiCabo VerdeCambodiaCameroonCanadaCaribbean small statesCentral Europe and the BalticsChadChileColombiaComorosCongo, Dem. Rep.Congo, Rep.Costa RicaCote d'IvoireCroatiaCubaCyprusCzech RepublicDenmarkDjiboutiDominican RepublicEarly-demographic dividendEast Asia & PacificEcuadorEgypt, Arab Rep.El SalvadorEquatorial GuineaEritreaEstoniaEthiopiaEuro areaEurope & Central AsiaEurope & Central Asia (excluding high income)Europe & Central Asia (IDA & IBRD countries)European UnionFijiFinlandFranceGabonGambia, TheGeorgiaGermanyGhanaGreeceGuatemalaGuineaGuinea-BissauHaitiHeavily indebted poor countries (HIPC)High incomeHondurasHong Kong SAR, ChinaHungaryIBRD onlyIcelandIDA & IBRD totalIDA blendIDA onlyIDA totalIndiaIndonesiaIran, Islamic Rep.IrelandIsraelItalyJamaicaJapanJordanKazakhstanKenyaKorea, Rep.KosovoKuwaitKyrgyz RepublicLao PDRLatin America & Caribbean Latin America & Caribbean (excluding high income)Latin America & the Caribbean (IDA & IBRD countries)LatviaLeast developed countries: UN classificationLebanonLiberiaLibyaLithuaniaLow & middle incomeLow incomeLower middle incomeLuxembourgMacao SAR, ChinaMacedonia, FYRMadagascarMalawiMalaysiaMaliMaltaMauritaniaMauritiusMexicoMiddle East & North AfricaMiddle East & North Africa (excluding high income)Middle East & North Africa (IDA & IBRD countries)Middle incomeMoldovaMongoliaMontenegroMoroccoMozambiqueMyanmarNamibiaNepalNetherlandsNew ZealandNicaraguaNigerNigeriaNorth AmericaNorwayOECD membersOmanOther small statesPakistanPanamaPapua New GuineaParaguayPeruPhilippinesPolandPortugalPost-demographic dividendPre-demographic dividendPuerto RicoQatarRomaniaRussian FederationRwandaSamoaSaudi ArabiaSenegalSerbiaSeychellesSierra LeoneSingaporeSlovak RepublicSloveniaSmall statesSomaliaSouth AfricaSouth AsiaSouth Asia (IDA & IBRD)South SudanSpainSri LankaSub-Saharan Africa Sub-Saharan Africa (excluding high income)Sub-Saharan Africa (IDA & IBRD countries)SudanSurinameSwazilandSwedenSwitzerlandSyrian Arab RepublicTajikistanTanzaniaThailandTimor-LesteTogoTrinidad and TobagoTunisiaTurkeyTurkmenistanUgandaUkraineUnited Arab EmiratesUnited KingdomUnited StatesUruguayUzbekistanVanuatuVenezuela, RBVietnamWest Bank and GazaWorldZambiaZimbabwe Timeline:
This timeline shows a graph from 1992 to 2016 of Europe & Central Asia (excluding high income). No data until 1991. Number of actual observations by date: 25.
Source name:
World Development Indicators
Source organization:
World Bank national accounts data, and OECD National Accounts data files.
Categories, topics:
Economy & Growth, Trade
Last updated:
apr 23, 2017
Indicators value changes by year
Minimum:
-32.569
jan 1, 1992
Maximum:
23.152
jan 1, 2001
At the date of observation
Value
Absolute change
Change from previous value
jan 1, 1992
-32.569
-32.569
0.0%
jan 1, 1993
-29.33
+3.238
-9.94%
jan 1, 1994
-10.632
+18.698
-63.75%
jan 1, 1995
-1.29
+9.342
-87.86%
jan 1, 1996
6.8
+8.091
-627.0%
jan 1, 1997
6.897
+0.097
1.43%
jan 1, 1998
7.311
+0.414
6.0%
jan 1, 1999
-4.726
-12.037
-164.63%
jan 1, 2000
-10.467
-5.742
121.51%
jan 1, 2001
23.152
+33.619
-321.18%
jan 1, 2002
0.451
-22.701
-98.05%
jan 1, 2003
12.898
+12.446
2.76K%
jan 1, 2004
14.629
+1.731
13.42%
jan 1, 2005
20.644
+6.015
41.12%
jan 1, 2006
11.763
-8.881
-43.02%
jan 1, 2007
14.702
+2.939
24.99%
jan 1, 2008
20.2
+5.499
37.4%
jan 1, 2009
7.433
-12.767
-63.2%
jan 1, 2010
-23.632
-31.066
-417.93%
jan 1, 2011
16.998
+40.63
-171.93%
jan 1, 2012
14.882
-2.116
-12.45%
jan 1, 2013
6.198
-8.684
-58.35%
jan 1, 2014
4.491
-1.707
-27.54%
jan 1, 2015
-3.848
-8.339
-185.69%
jan 1, 2016
-11.427
-7.579
196.95%
Ranking of countries by current statistics by years


Comments: