29
/
en
AIzaSyAYiBZKx7MnpbEhh9jyipgxe19OcubqV5w
April 1, 2024
74027
Austria
AUT
true
2
1
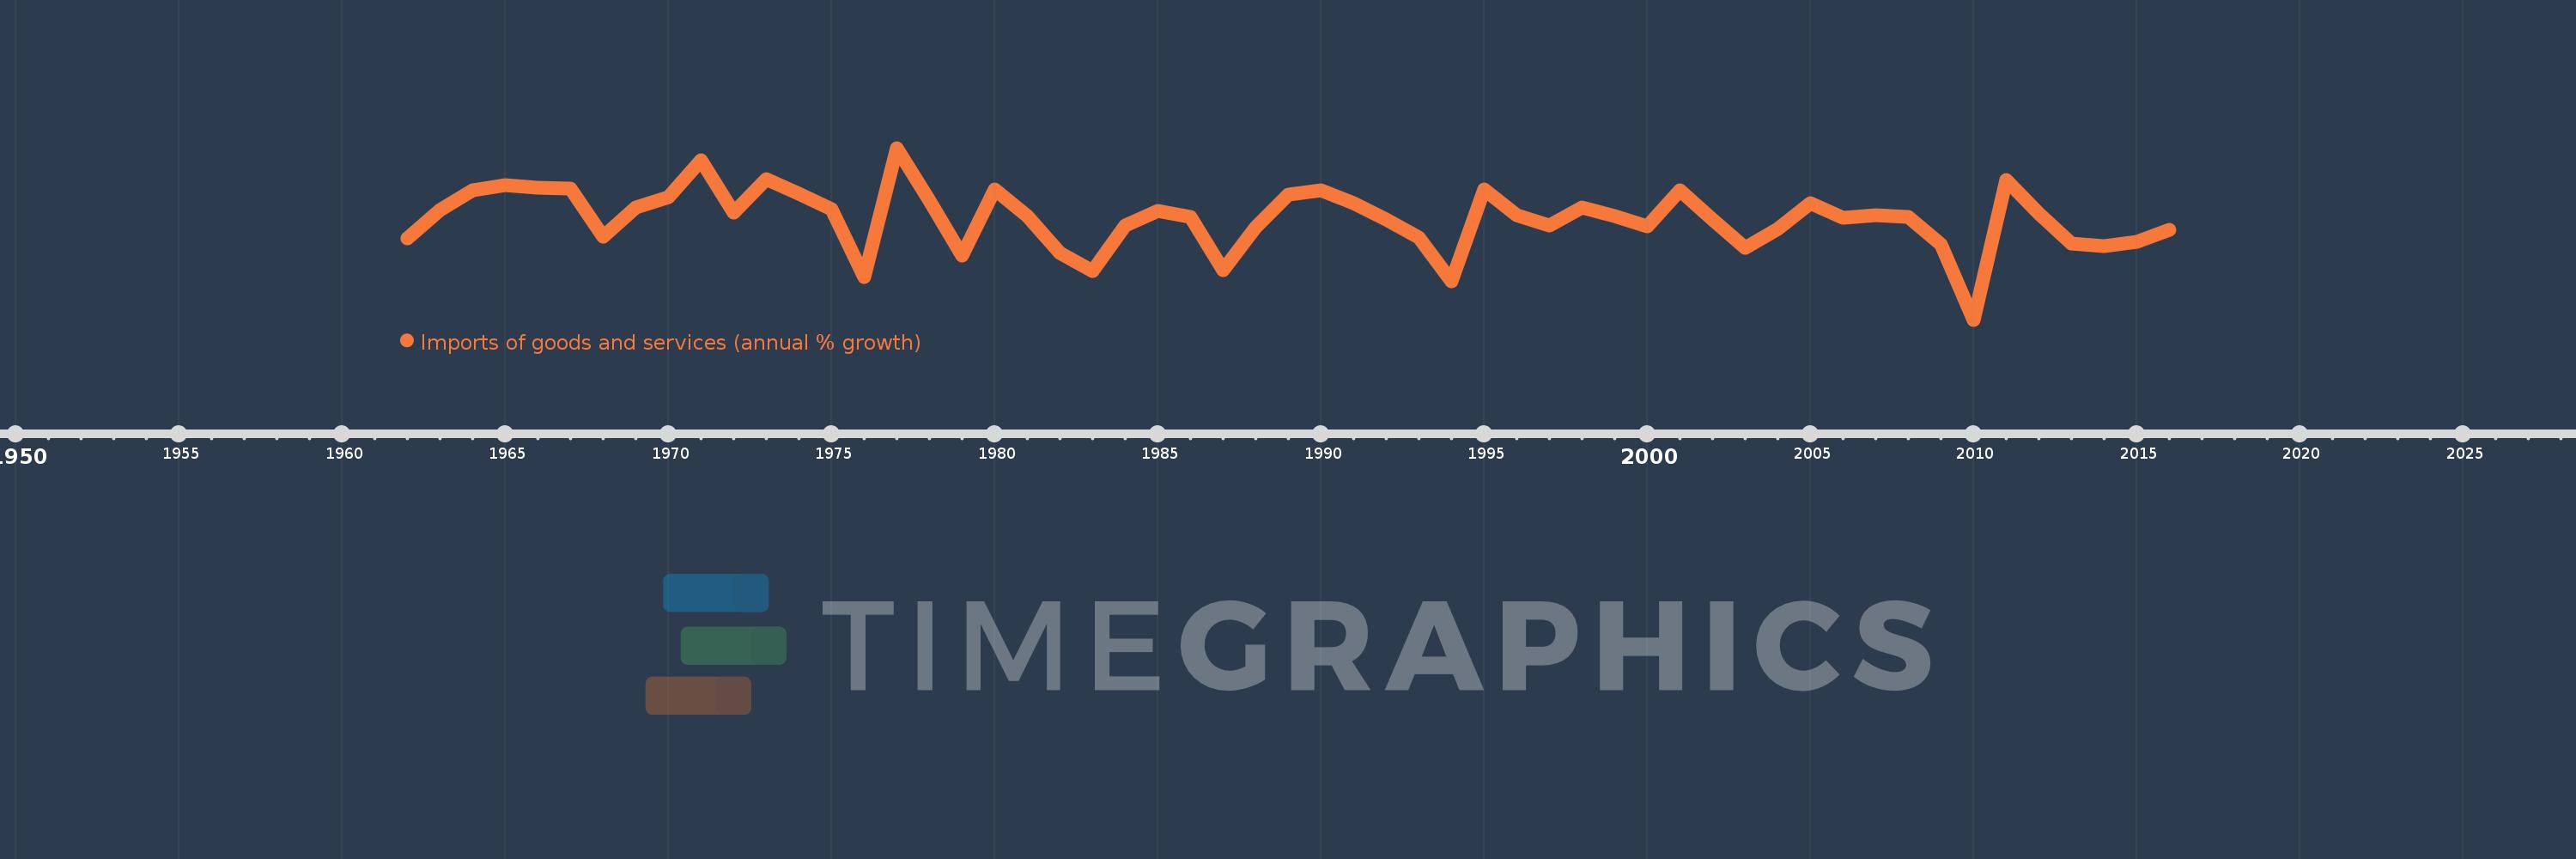
Imports of goods and services (annual % growth)
2016,2015,2014,2013,2012,2011,2010,2009,2008,2007,2006,2005,2004,2003,2002,2001,2000,1999,1998,1997,1996,1995,1994,1993,1992,1991,1990,1989,1988,1987,1986,1985,1984,1983,1982,1981,1980,1979,1978,1977,1976,1975,1974,1973,1972,1971,1970,1969,1968,1967,1966,1965,1964,1963,1962
This statistics in other country:
AlbaniaAlgeriaAngolaAntigua and BarbudaArab WorldArgentinaArmeniaAustraliaAustriaAzerbaijanBahamas, TheBahrainBangladeshBarbadosBelarusBelgiumBelizeBeninBhutanBoliviaBosnia and HerzegovinaBotswanaBrazilBrunei DarussalamBulgariaBurkina FasoBurundiCabo VerdeCambodiaCameroonCanadaCaribbean small statesCentral Europe and the BalticsChadChileColombiaComorosCongo, Dem. Rep.Congo, Rep.Costa RicaCote d'IvoireCroatiaCubaCyprusCzech RepublicDenmarkDjiboutiDominican RepublicEarly-demographic dividendEast Asia & PacificEcuadorEgypt, Arab Rep.El SalvadorEquatorial GuineaEritreaEstoniaEthiopiaEuro areaEurope & Central AsiaEurope & Central Asia (excluding high income)Europe & Central Asia (IDA & IBRD countries)European UnionFijiFinlandFranceGabonGambia, TheGeorgiaGermanyGhanaGreeceGuatemalaGuineaGuinea-BissauHaitiHeavily indebted poor countries (HIPC)High incomeHondurasHong Kong SAR, ChinaHungaryIBRD onlyIcelandIDA & IBRD totalIDA blendIDA onlyIDA totalIndiaIndonesiaIran, Islamic Rep.IrelandIsraelItalyJamaicaJapanJordanKazakhstanKenyaKorea, Rep.KosovoKuwaitKyrgyz RepublicLao PDRLatin America & Caribbean Latin America & Caribbean (excluding high income)Latin America & the Caribbean (IDA & IBRD countries)LatviaLeast developed countries: UN classificationLebanonLiberiaLibyaLithuaniaLow & middle incomeLow incomeLower middle incomeLuxembourgMacao SAR, ChinaMacedonia, FYRMadagascarMalawiMalaysiaMaliMaltaMauritaniaMauritiusMexicoMiddle East & North AfricaMiddle East & North Africa (excluding high income)Middle East & North Africa (IDA & IBRD countries)Middle incomeMoldovaMongoliaMontenegroMoroccoMozambiqueMyanmarNamibiaNepalNetherlandsNew ZealandNicaraguaNigerNigeriaNorth AmericaNorwayOECD membersOmanOther small statesPakistanPanamaPapua New GuineaParaguayPeruPhilippinesPolandPortugalPost-demographic dividendPre-demographic dividendPuerto RicoQatarRomaniaRussian FederationRwandaSamoaSaudi ArabiaSenegalSerbiaSeychellesSierra LeoneSingaporeSlovak RepublicSloveniaSmall statesSomaliaSouth AfricaSouth AsiaSouth Asia (IDA & IBRD)South SudanSpainSri LankaSub-Saharan Africa Sub-Saharan Africa (excluding high income)Sub-Saharan Africa (IDA & IBRD countries)SudanSurinameSwazilandSwedenSwitzerlandSyrian Arab RepublicTajikistanTanzaniaThailandTimor-LesteTogoTrinidad and TobagoTunisiaTurkeyTurkmenistanUgandaUkraineUnited Arab EmiratesUnited KingdomUnited StatesUruguayUzbekistanVanuatuVenezuela, RBVietnamWest Bank and GazaWorldZambiaZimbabwe Timeline:
This timeline shows a graph from 1962 to 2016 of Austria. No data until 1961. Number of actual observations by date: 55.
Source name:
World Development Indicators
Source organization:
World Bank national accounts data, and OECD National Accounts data files.
Categories, topics:
Economy & Growth, Trade
Last updated:
apr 23, 2017
Indicators value changes by year
Minimum:
-12.019
jan 1, 2010
Maximum:
17.418
jan 1, 1977
At the date of observation
Value
Absolute change
Change from previous value
jan 1, 1962
1.856
+1.856
0.0%
jan 1, 1963
6.834
+4.978
268.17%
jan 1, 1964
10.235
+3.401
49.77%
jan 1, 1965
11.025
+0.791
7.72%
jan 1, 1966
10.627
-0.398
-3.61%
jan 1, 1967
10.383
-0.244
-2.3%
jan 1, 1968
2.26
-8.123
-78.23%
jan 1, 1969
7.231
+4.97
219.92%
jan 1, 1970
9.017
+1.787
24.71%
jan 1, 1971
15.281
+6.264
69.47%
jan 1, 1972
6.288
-8.994
-58.85%
jan 1, 1973
12.146
+5.859
93.18%
jan 1, 1974
9.553
-2.593
-21.35%
jan 1, 1975
6.905
-2.648
-27.72%
jan 1, 1976
-4.649
-11.554
-167.32%
jan 1, 1977
17.418
+22.066
-474.67%
jan 1, 1978
8.441
-8.976
-51.53%
jan 1, 1979
-1.008
-9.45
-111.94%
jan 1, 1980
10.246
+11.254
-1.12K%
jan 1, 1981
5.708
-4.538
-44.29%
jan 1, 1982
-0.606
-6.314
-110.62%
jan 1, 1983
-3.629
-3.023
498.51%
jan 1, 1984
4.177
+7.806
-215.1%
jan 1, 1985
6.643
+2.466
59.05%
jan 1, 1986
5.538
-1.105
-16.64%
jan 1, 1987
-3.541
-9.079
-163.95%
jan 1, 1988
3.833
+7.374
-208.24%
jan 1, 1989
9.442
+5.609
146.34%
jan 1, 1990
10.158
+0.716
7.58%
jan 1, 1991
7.98
-2.178
-21.44%
jan 1, 1992
5.114
-2.866
-35.91%
jan 1, 1993
2.116
-2.998
-58.62%
jan 1, 1994
-5.489
-7.606
-359.41%
jan 1, 1995
10.332
+15.821
-288.21%
jan 1, 1996
5.905
-4.427
-42.85%
jan 1, 1997
4.16
-1.745
-29.56%
jan 1, 1998
7.263
+3.104
74.62%
jan 1, 1999
5.751
-1.512
-20.82%
jan 1, 2000
4.053
-1.698
-29.53%
jan 1, 2001
10.192
+6.139
151.48%
jan 1, 2002
5.181
-5.011
-49.16%
jan 1, 2003
0.292
-4.889
-94.37%
jan 1, 2004
3.508
+3.217
1.1K%
jan 1, 2005
7.995
+4.487
127.89%
jan 1, 2006
5.447
-2.548
-31.86%
jan 1, 2007
5.863
+0.416
7.63%
jan 1, 2008
5.617
-0.246
-4.19%
jan 1, 2009
0.919
-4.698
-83.64%
jan 1, 2010
-12.019
-12.938
-1.41K%
jan 1, 2011
11.989
+24.008
-199.75%
jan 1, 2012
6.203
-5.786
-48.26%
jan 1, 2013
1.093
-5.11
-82.37%
jan 1, 2014
0.651
-0.442
-40.42%
jan 1, 2015
1.311
+0.659
101.17%
jan 1, 2016
3.382
+2.071
158.05%
Ranking of countries by current statistics by years


Comments: