29
/
en
AIzaSyAYiBZKx7MnpbEhh9jyipgxe19OcubqV5w
April 1, 2024
266959
Trinidad and Tobago
TTO
true
2
1
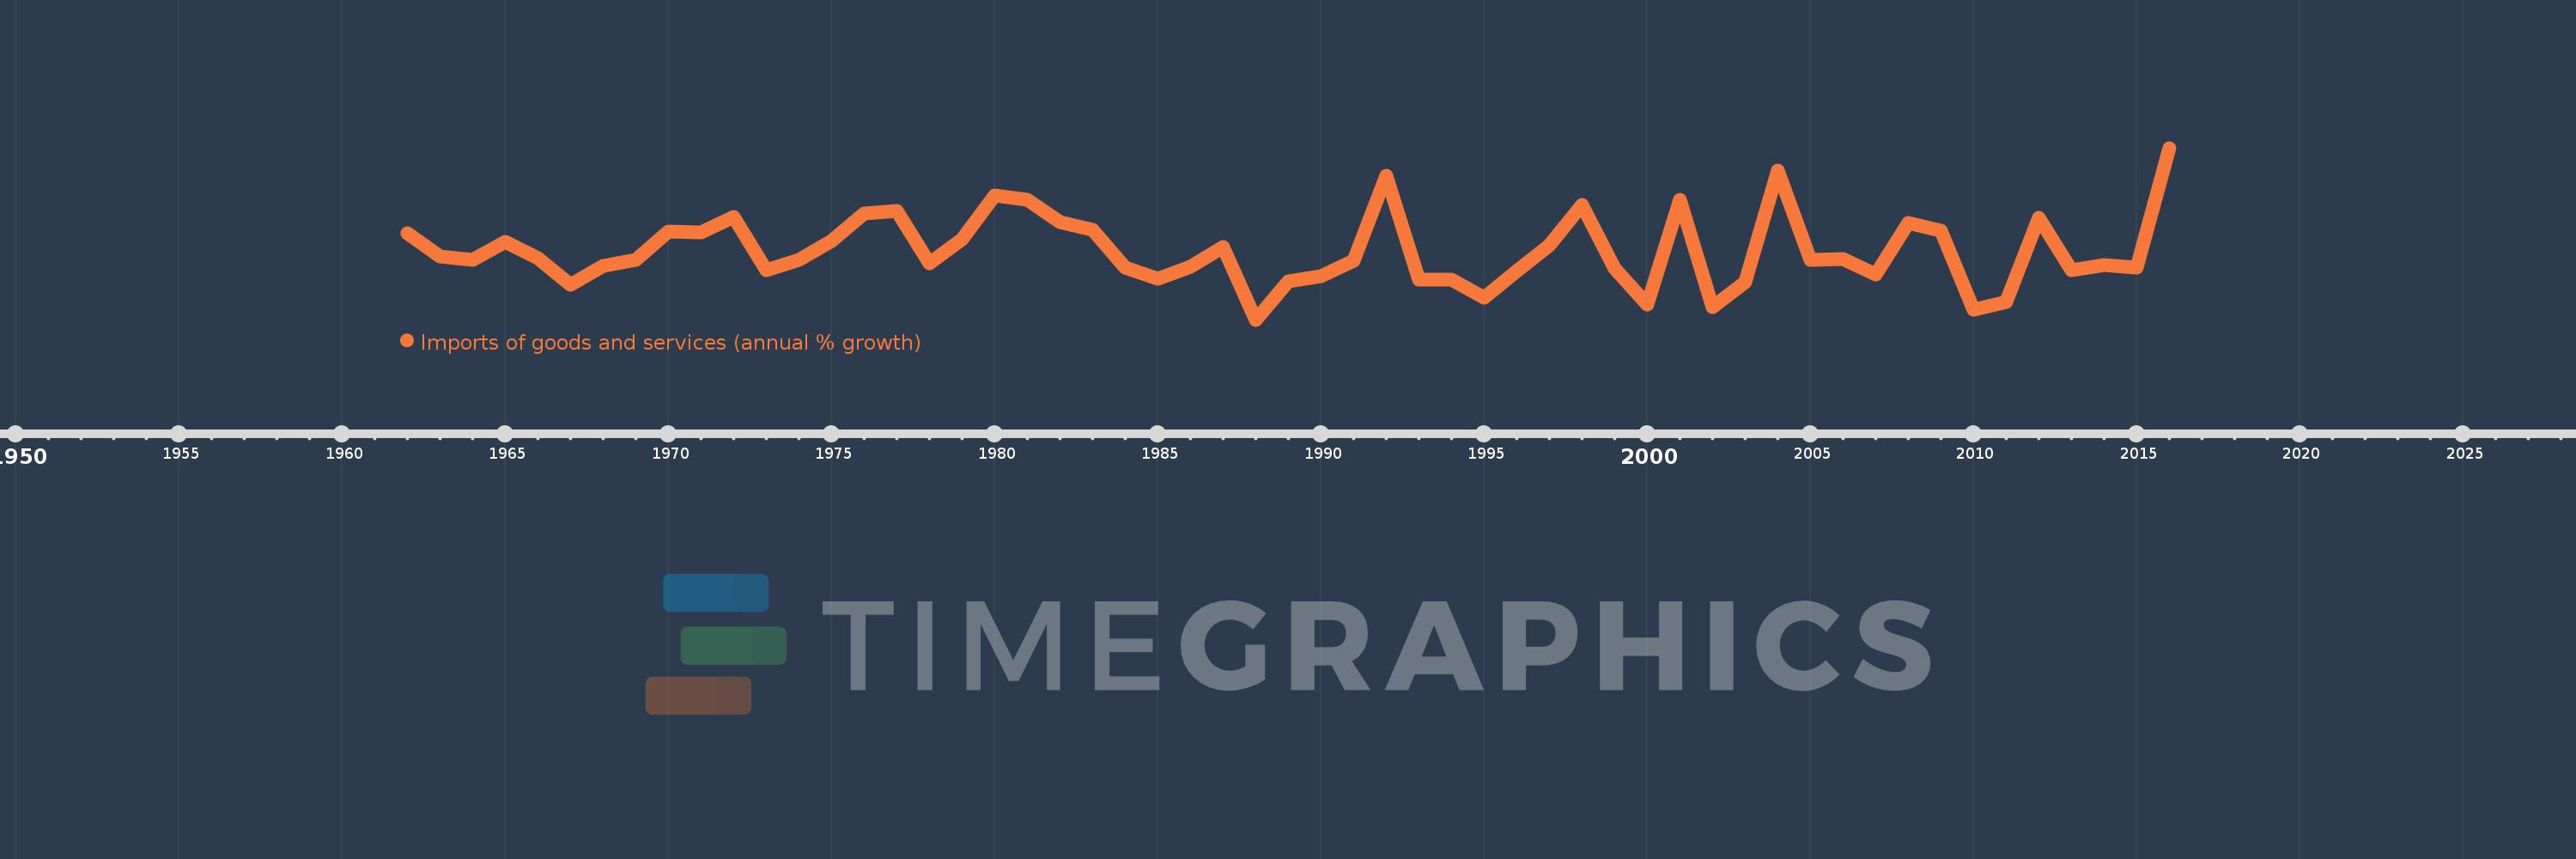
Imports of goods and services (annual % growth)
2016,2015,2014,2013,2012,2011,2010,2009,2008,2007,2006,2005,2004,2003,2002,2001,2000,1999,1998,1997,1996,1995,1994,1993,1992,1991,1990,1989,1988,1987,1986,1985,1984,1983,1982,1981,1980,1979,1978,1977,1976,1975,1974,1973,1972,1971,1970,1969,1968,1967,1966,1965,1964,1963,1962
This statistics in other country:
AlbaniaAlgeriaAngolaAntigua and BarbudaArab WorldArgentinaArmeniaAustraliaAustriaAzerbaijanBahamas, TheBahrainBangladeshBarbadosBelarusBelgiumBelizeBeninBhutanBoliviaBosnia and HerzegovinaBotswanaBrazilBrunei DarussalamBulgariaBurkina FasoBurundiCabo VerdeCambodiaCameroonCanadaCaribbean small statesCentral Europe and the BalticsChadChileColombiaComorosCongo, Dem. Rep.Congo, Rep.Costa RicaCote d'IvoireCroatiaCubaCyprusCzech RepublicDenmarkDjiboutiDominican RepublicEarly-demographic dividendEast Asia & PacificEcuadorEgypt, Arab Rep.El SalvadorEquatorial GuineaEritreaEstoniaEthiopiaEuro areaEurope & Central AsiaEurope & Central Asia (excluding high income)Europe & Central Asia (IDA & IBRD countries)European UnionFijiFinlandFranceGabonGambia, TheGeorgiaGermanyGhanaGreeceGuatemalaGuineaGuinea-BissauHaitiHeavily indebted poor countries (HIPC)High incomeHondurasHong Kong SAR, ChinaHungaryIBRD onlyIcelandIDA & IBRD totalIDA blendIDA onlyIDA totalIndiaIndonesiaIran, Islamic Rep.IrelandIsraelItalyJamaicaJapanJordanKazakhstanKenyaKorea, Rep.KosovoKuwaitKyrgyz RepublicLao PDRLatin America & Caribbean Latin America & Caribbean (excluding high income)Latin America & the Caribbean (IDA & IBRD countries)LatviaLeast developed countries: UN classificationLebanonLiberiaLibyaLithuaniaLow & middle incomeLow incomeLower middle incomeLuxembourgMacao SAR, ChinaMacedonia, FYRMadagascarMalawiMalaysiaMaliMaltaMauritaniaMauritiusMexicoMiddle East & North AfricaMiddle East & North Africa (excluding high income)Middle East & North Africa (IDA & IBRD countries)Middle incomeMoldovaMongoliaMontenegroMoroccoMozambiqueMyanmarNamibiaNepalNetherlandsNew ZealandNicaraguaNigerNigeriaNorth AmericaNorwayOECD membersOmanOther small statesPakistanPanamaPapua New GuineaParaguayPeruPhilippinesPolandPortugalPost-demographic dividendPre-demographic dividendPuerto RicoQatarRomaniaRussian FederationRwandaSamoaSaudi ArabiaSenegalSerbiaSeychellesSierra LeoneSingaporeSlovak RepublicSloveniaSmall statesSomaliaSouth AfricaSouth AsiaSouth Asia (IDA & IBRD)South SudanSpainSri LankaSub-Saharan Africa Sub-Saharan Africa (excluding high income)Sub-Saharan Africa (IDA & IBRD countries)SudanSurinameSwazilandSwedenSwitzerlandSyrian Arab RepublicTajikistanTanzaniaThailandTimor-LesteTogoTrinidad and TobagoTunisiaTurkeyTurkmenistanUgandaUkraineUnited Arab EmiratesUnited KingdomUnited StatesUruguayUzbekistanVanuatuVenezuela, RBVietnamWest Bank and GazaWorldZambiaZimbabwe Timeline:
This timeline shows a graph from 1962 to 2016 of Trinidad and Tobago. No data until 1961. Number of actual observations by date: 55.
Source name:
World Development Indicators
Source organization:
World Bank national accounts data, and OECD National Accounts data files.
Categories, topics:
Economy & Growth, Trade
Last updated:
apr 23, 2017
Indicators value changes by year
Minimum:
-26.273
jan 1, 1988
At the date of observation
Value
Absolute change
Change from previous value
jan 1, 1962
14.975
+14.975
0.0%
jan 1, 1963
4.194
-10.781
-71.99%
jan 1, 1964
2.331
-1.864
-44.43%
jan 1, 1965
10.973
+8.643
370.85%
jan 1, 1966
3.387
-7.586
-69.13%
jan 1, 1967
-9.458
-12.845
-379.25%
jan 1, 1968
-0.459
+9.0
-95.15%
jan 1, 1969
2.343
+2.802
-611.04%
jan 1, 1970
15.89
+13.547
578.13%
jan 1, 1971
15.653
-0.237
-1.49%
jan 1, 1972
23.127
+7.474
47.75%
jan 1, 1973
-2.68
-25.807
-111.59%
jan 1, 1974
2.352
+5.032
-187.75%
jan 1, 1975
11.44
+9.089
386.49%
jan 1, 1976
24.794
+13.354
116.72%
jan 1, 1977
25.946
+1.152
4.64%
jan 1, 1978
0.578
-25.368
-97.77%
jan 1, 1979
12.481
+11.904
2.06K%
jan 1, 1980
33.421
+20.94
167.77%
jan 1, 1981
31.103
-2.318
-6.94%
jan 1, 1982
20.633
-10.47
-33.66%
jan 1, 1983
16.775
-3.858
-18.7%
jan 1, 1984
-1.196
-17.971
-107.13%
jan 1, 1985
-6.461
-5.266
440.37%
jan 1, 1986
-0.734
+5.727
-88.64%
jan 1, 1987
8.402
+9.136
-1.24K%
jan 1, 1988
-26.273
-34.675
-412.7%
jan 1, 1989
-8.075
+18.198
-69.26%
jan 1, 1990
-5.255
+2.82
-34.93%
jan 1, 1991
1.95
+7.205
-137.11%
jan 1, 1992
42.809
+40.859
2.1K%
jan 1, 1993
-7.125
-49.934
-116.64%
jan 1, 1994
-7.178
-0.053
0.74%
jan 1, 1995
-15.801
-8.623
120.14%
jan 1, 1996
-2.966
+12.836
-81.23%
jan 1, 1997
9.372
+12.337
-416.01%
jan 1, 1998
28.748
+19.376
206.75%
jan 1, 1999
-1.611
-30.359
-105.61%
jan 1, 2000
-18.971
-17.359
1.08K%
jan 1, 2001
31.065
+50.036
-263.75%
jan 1, 2002
-20.308
-51.372
-165.37%
jan 1, 2003
-8.353
+11.955
-58.87%
jan 1, 2004
45.34
+53.693
-642.82%
jan 1, 2005
2.492
-42.848
-94.5%
jan 1, 2006
2.787
+0.296
11.86%
jan 1, 2007
-4.475
-7.262
-260.55%
jan 1, 2008
20.272
+24.746
-553.0%
jan 1, 2009
16.238
-4.033
-19.9%
jan 1, 2010
-21.29
-37.528
-231.11%
jan 1, 2011
-17.87
+3.421
-16.07%
jan 1, 2012
22.365
+40.235
-225.16%
jan 1, 2013
-2.392
-24.758
-110.7%
jan 1, 2014
-0.061
+2.331
-97.44%
jan 1, 2015
-1.137
-1.076
1.76K%
jan 1, 2016
56.01
+57.148
-5.02K%
Ranking of countries by current statistics by years


Comments: