29
/
en
AIzaSyAYiBZKx7MnpbEhh9jyipgxe19OcubqV5w
April 1, 2024
52695
OECD members
OED
false
2
1
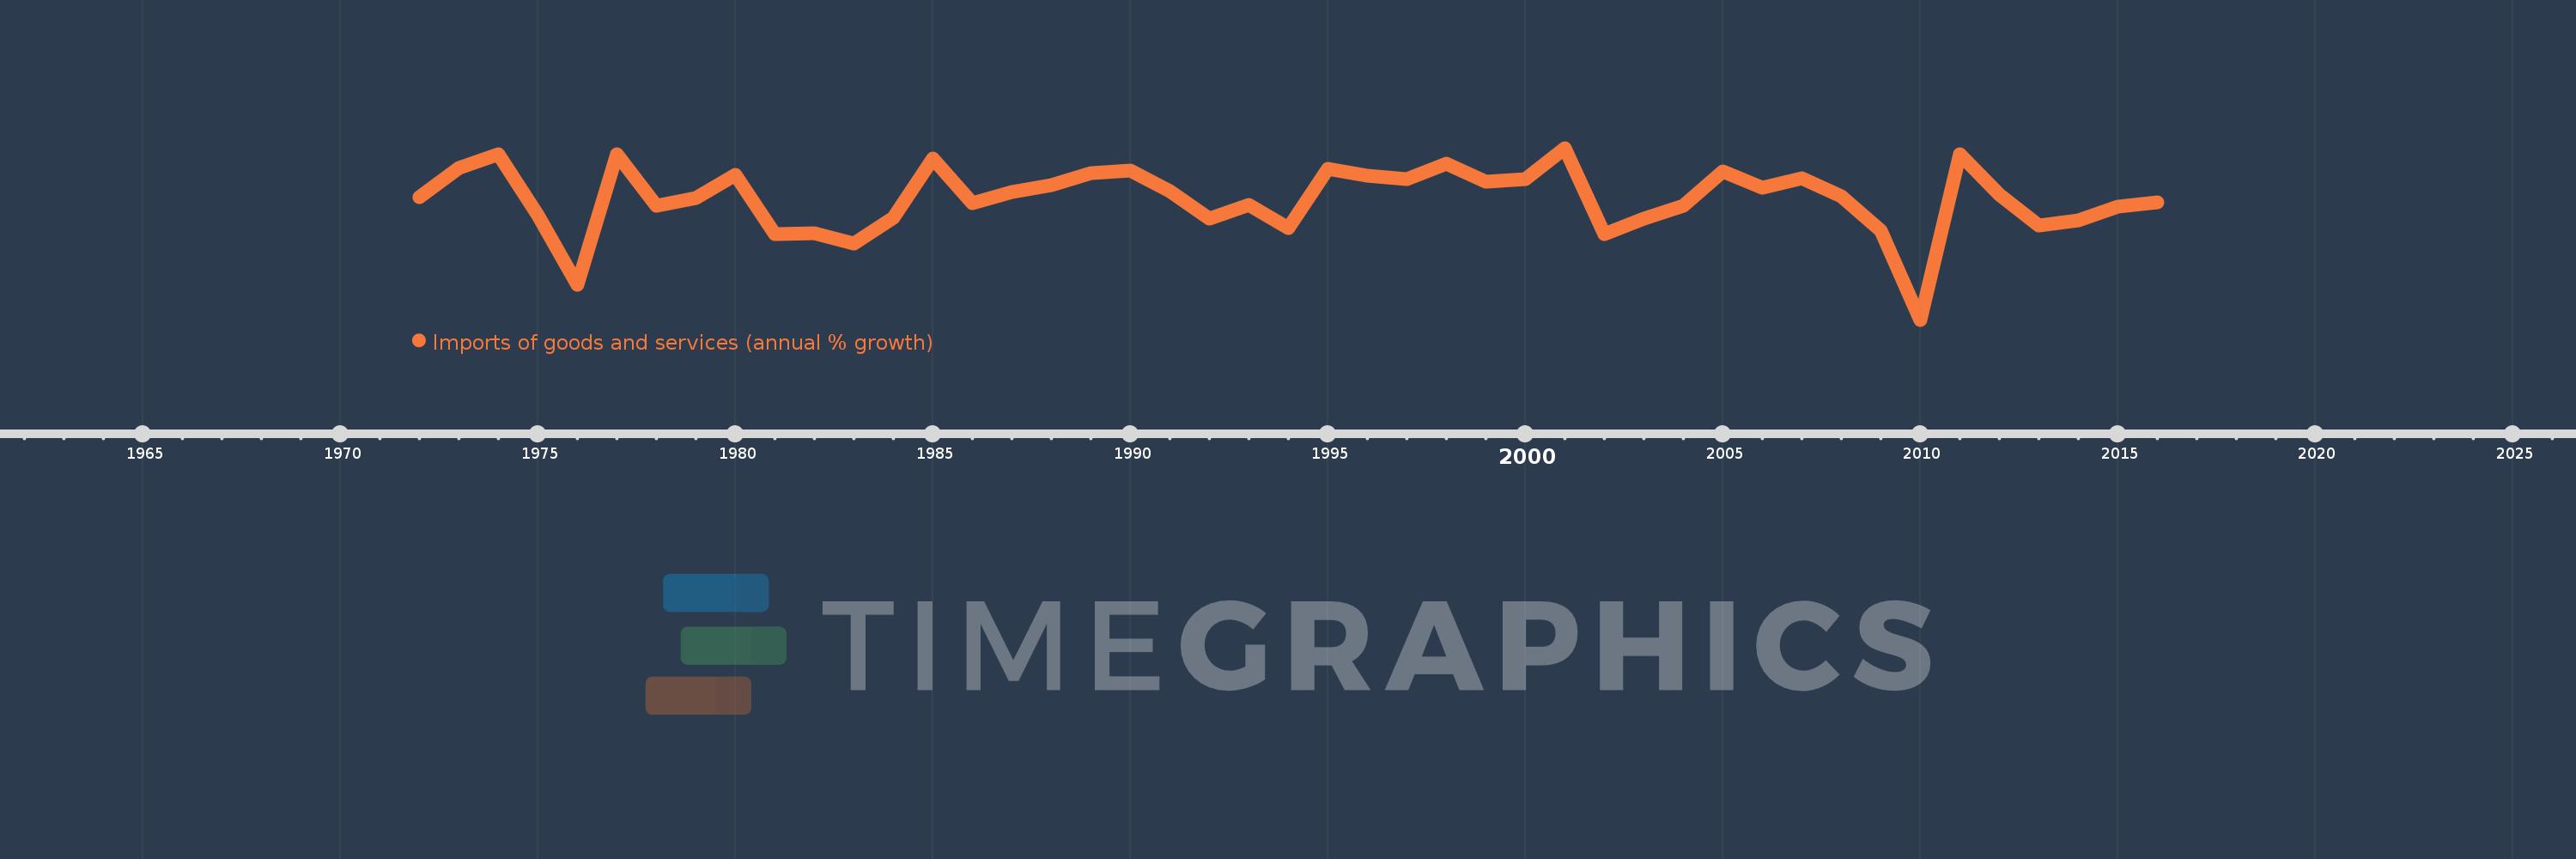
Imports of goods and services (annual % growth)
2016,2015,2014,2013,2012,2011,2010,2009,2008,2007,2006,2005,2004,2003,2002,2001,2000,1999,1998,1997,1996,1995,1994,1993,1992,1991,1990,1989,1988,1987,1986,1985,1984,1983,1982,1981,1980,1979,1978,1977,1976,1975,1974,1973,1972
This statistics in other country:
AlbaniaAlgeriaAngolaAntigua and BarbudaArab WorldArgentinaArmeniaAustraliaAustriaAzerbaijanBahamas, TheBahrainBangladeshBarbadosBelarusBelgiumBelizeBeninBhutanBoliviaBosnia and HerzegovinaBotswanaBrazilBrunei DarussalamBulgariaBurkina FasoBurundiCabo VerdeCambodiaCameroonCanadaCaribbean small statesCentral Europe and the BalticsChadChileColombiaComorosCongo, Dem. Rep.Congo, Rep.Costa RicaCote d'IvoireCroatiaCubaCyprusCzech RepublicDenmarkDjiboutiDominican RepublicEarly-demographic dividendEast Asia & PacificEcuadorEgypt, Arab Rep.El SalvadorEquatorial GuineaEritreaEstoniaEthiopiaEuro areaEurope & Central AsiaEurope & Central Asia (excluding high income)Europe & Central Asia (IDA & IBRD countries)European UnionFijiFinlandFranceGabonGambia, TheGeorgiaGermanyGhanaGreeceGuatemalaGuineaGuinea-BissauHaitiHeavily indebted poor countries (HIPC)High incomeHondurasHong Kong SAR, ChinaHungaryIBRD onlyIcelandIDA & IBRD totalIDA blendIDA onlyIDA totalIndiaIndonesiaIran, Islamic Rep.IrelandIsraelItalyJamaicaJapanJordanKazakhstanKenyaKorea, Rep.KosovoKuwaitKyrgyz RepublicLao PDRLatin America & Caribbean Latin America & Caribbean (excluding high income)Latin America & the Caribbean (IDA & IBRD countries)LatviaLeast developed countries: UN classificationLebanonLiberiaLibyaLithuaniaLow & middle incomeLow incomeLower middle incomeLuxembourgMacao SAR, ChinaMacedonia, FYRMadagascarMalawiMalaysiaMaliMaltaMauritaniaMauritiusMexicoMiddle East & North AfricaMiddle East & North Africa (excluding high income)Middle East & North Africa (IDA & IBRD countries)Middle incomeMoldovaMongoliaMontenegroMoroccoMozambiqueMyanmarNamibiaNepalNetherlandsNew ZealandNicaraguaNigerNigeriaNorth AmericaNorwayOECD membersOmanOther small statesPakistanPanamaPapua New GuineaParaguayPeruPhilippinesPolandPortugalPost-demographic dividendPre-demographic dividendPuerto RicoQatarRomaniaRussian FederationRwandaSamoaSaudi ArabiaSenegalSerbiaSeychellesSierra LeoneSingaporeSlovak RepublicSloveniaSmall statesSomaliaSouth AfricaSouth AsiaSouth Asia (IDA & IBRD)South SudanSpainSri LankaSub-Saharan Africa Sub-Saharan Africa (excluding high income)Sub-Saharan Africa (IDA & IBRD countries)SudanSurinameSwazilandSwedenSwitzerlandSyrian Arab RepublicTajikistanTanzaniaThailandTimor-LesteTogoTrinidad and TobagoTunisiaTurkeyTurkmenistanUgandaUkraineUnited Arab EmiratesUnited KingdomUnited StatesUruguayUzbekistanVanuatuVenezuela, RBVietnamWest Bank and GazaWorldZambiaZimbabwe Timeline:
This timeline shows a graph from 1972 to 2016 of OECD members. No data until 1971. Number of actual observations by date: 45.
Source name:
World Development Indicators
Source organization:
World Bank national accounts data, and OECD National Accounts data files.
Categories, topics:
Economy & Growth, Trade
Last updated:
apr 23, 2017
Indicators value changes by year
Minimum:
-11.794
jan 1, 2010
Maximum:
12.193
jan 1, 2001
At the date of observation
Value
Absolute change
Change from previous value
jan 1, 1972
5.319
+5.319
0.0%
jan 1, 1973
9.346
+4.027
75.71%
jan 1, 1974
11.303
+1.957
20.93%
jan 1, 1975
2.857
-8.446
-74.72%
jan 1, 1976
-6.962
-9.819
-343.67%
jan 1, 1977
11.329
+18.29
-262.72%
jan 1, 1978
4.154
-7.174
-63.33%
jan 1, 1979
5.153
+0.999
24.04%
jan 1, 1980
8.493
+3.34
64.82%
jan 1, 1981
0.161
-8.332
-98.1%
jan 1, 1982
0.313
+0.151
93.67%
jan 1, 1983
-1.171
-1.484
-474.52%
jan 1, 1984
2.395
+3.566
-304.54%
jan 1, 1985
10.762
+8.367
349.37%
jan 1, 1986
4.464
-6.298
-58.52%
jan 1, 1987
6.051
+1.587
35.54%
jan 1, 1988
6.959
+0.907
15.0%
jan 1, 1989
8.641
+1.682
24.18%
jan 1, 1990
8.979
+0.338
3.91%
jan 1, 1991
6.103
-2.876
-32.03%
jan 1, 1992
2.373
-3.73
-61.12%
jan 1, 1993
4.232
+1.859
78.36%
jan 1, 1994
0.968
-3.265
-77.13%
jan 1, 1995
9.228
+8.26
853.48%
jan 1, 1996
8.356
-0.872
-9.45%
jan 1, 1997
7.84
-0.516
-6.18%
jan 1, 1998
9.998
+2.158
27.53%
jan 1, 1999
7.431
-2.567
-25.68%
jan 1, 2000
7.865
+0.434
5.84%
jan 1, 2001
12.193
+4.328
55.03%
jan 1, 2002
0.137
-12.056
-98.88%
jan 1, 2003
2.338
+2.201
1.61K%
jan 1, 2004
4.127
+1.789
76.51%
jan 1, 2005
8.904
+4.777
115.75%
jan 1, 2006
6.614
-2.29
-25.72%
jan 1, 2007
7.918
+1.303
19.71%
jan 1, 2008
5.488
-2.429
-30.68%
jan 1, 2009
0.584
-4.905
-89.36%
jan 1, 2010
-11.794
-12.377
-2.12K%
jan 1, 2011
11.319
+23.113
-195.98%
jan 1, 2012
5.673
-5.646
-49.88%
jan 1, 2013
1.342
-4.332
-76.35%
jan 1, 2014
2.097
+0.756
56.34%
jan 1, 2015
4.016
+1.919
91.49%
jan 1, 2016
4.568
+0.551
13.73%
Ranking of countries by current statistics by years


Comments: