29
/
en
AIzaSyAYiBZKx7MnpbEhh9jyipgxe19OcubqV5w
April 1, 2024
193145
Mauritania
MRT
true
2
1
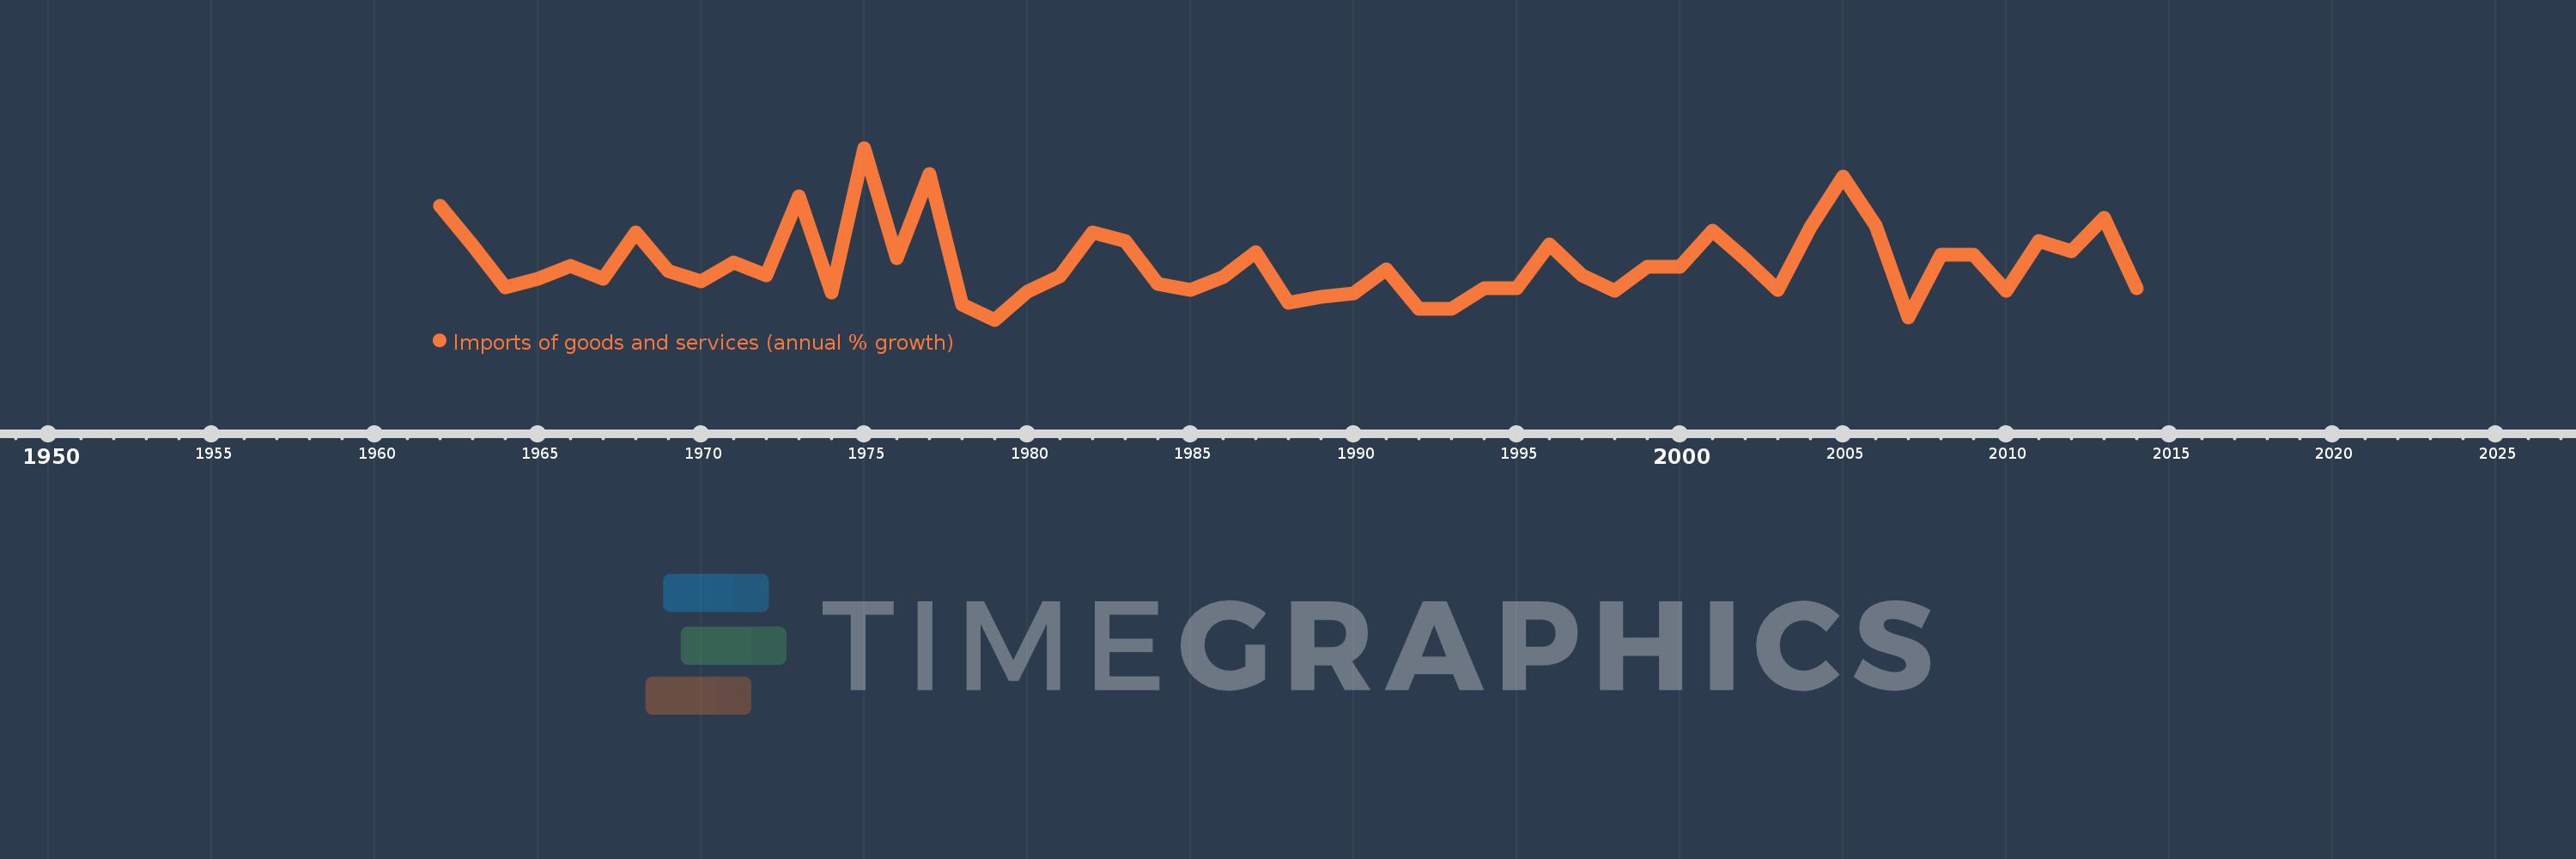
Imports of goods and services (annual % growth)
2014,2013,2012,2011,2010,2009,2008,2007,2006,2005,2004,2003,2002,2001,2000,1999,1998,1997,1996,1995,1994,1993,1992,1991,1990,1989,1988,1987,1986,1985,1984,1983,1982,1981,1980,1979,1978,1977,1976,1975,1974,1973,1972,1971,1970,1969,1968,1967,1966,1965,1964,1963,1962
This statistics in other country:
AlbaniaAlgeriaAngolaAntigua and BarbudaArab WorldArgentinaArmeniaAustraliaAustriaAzerbaijanBahamas, TheBahrainBangladeshBarbadosBelarusBelgiumBelizeBeninBhutanBoliviaBosnia and HerzegovinaBotswanaBrazilBrunei DarussalamBulgariaBurkina FasoBurundiCabo VerdeCambodiaCameroonCanadaCaribbean small statesCentral Europe and the BalticsChadChileColombiaComorosCongo, Dem. Rep.Congo, Rep.Costa RicaCote d'IvoireCroatiaCubaCyprusCzech RepublicDenmarkDjiboutiDominican RepublicEarly-demographic dividendEast Asia & PacificEcuadorEgypt, Arab Rep.El SalvadorEquatorial GuineaEritreaEstoniaEthiopiaEuro areaEurope & Central AsiaEurope & Central Asia (excluding high income)Europe & Central Asia (IDA & IBRD countries)European UnionFijiFinlandFranceGabonGambia, TheGeorgiaGermanyGhanaGreeceGuatemalaGuineaGuinea-BissauHaitiHeavily indebted poor countries (HIPC)High incomeHondurasHong Kong SAR, ChinaHungaryIBRD onlyIcelandIDA & IBRD totalIDA blendIDA onlyIDA totalIndiaIndonesiaIran, Islamic Rep.IrelandIsraelItalyJamaicaJapanJordanKazakhstanKenyaKorea, Rep.KosovoKuwaitKyrgyz RepublicLao PDRLatin America & Caribbean Latin America & Caribbean (excluding high income)Latin America & the Caribbean (IDA & IBRD countries)LatviaLeast developed countries: UN classificationLebanonLiberiaLibyaLithuaniaLow & middle incomeLow incomeLower middle incomeLuxembourgMacao SAR, ChinaMacedonia, FYRMadagascarMalawiMalaysiaMaliMaltaMauritaniaMauritiusMexicoMiddle East & North AfricaMiddle East & North Africa (excluding high income)Middle East & North Africa (IDA & IBRD countries)Middle incomeMoldovaMongoliaMontenegroMoroccoMozambiqueMyanmarNamibiaNepalNetherlandsNew ZealandNicaraguaNigerNigeriaNorth AmericaNorwayOECD membersOmanOther small statesPakistanPanamaPapua New GuineaParaguayPeruPhilippinesPolandPortugalPost-demographic dividendPre-demographic dividendPuerto RicoQatarRomaniaRussian FederationRwandaSamoaSaudi ArabiaSenegalSerbiaSeychellesSierra LeoneSingaporeSlovak RepublicSloveniaSmall statesSomaliaSouth AfricaSouth AsiaSouth Asia (IDA & IBRD)South SudanSpainSri LankaSub-Saharan Africa Sub-Saharan Africa (excluding high income)Sub-Saharan Africa (IDA & IBRD countries)SudanSurinameSwazilandSwedenSwitzerlandSyrian Arab RepublicTajikistanTanzaniaThailandTimor-LesteTogoTrinidad and TobagoTunisiaTurkeyTurkmenistanUgandaUkraineUnited Arab EmiratesUnited KingdomUnited StatesUruguayUzbekistanVanuatuVenezuela, RBVietnamWest Bank and GazaWorldZambiaZimbabwe Timeline:
This timeline shows a graph from 1962 to 2014 of Mauritania. No data until 1961. Number of actual observations by date: 53.
Source name:
World Development Indicators
Source organization:
World Bank national accounts data, and OECD National Accounts data files.
Categories, topics:
Economy & Growth, Trade
Last updated:
apr 23, 2017
Indicators value changes by year
Minimum:
-20.544
jan 1, 1979
Maximum:
65.867
jan 1, 1975
At the date of observation
Value
Absolute change
Change from previous value
jan 1, 1962
36.911
+36.911
0.0%
jan 1, 1963
16.919
-19.993
-54.16%
jan 1, 1964
-4.471
-21.389
-126.42%
jan 1, 1965
0.246
+4.717
-105.51%
jan 1, 1966
6.757
+6.51
2.64K%
jan 1, 1967
0.265
-6.492
-96.08%
jan 1, 1968
23.524
+23.259
8.77K%
jan 1, 1969
4.029
-19.495
-82.87%
jan 1, 1970
-1.149
-5.178
-128.51%
jan 1, 1971
8.483
+9.632
-838.38%
jan 1, 1972
1.723
-6.76
-79.69%
jan 1, 1973
41.37
+39.647
2.3K%
jan 1, 1974
-6.797
-48.167
-116.43%
jan 1, 1975
65.867
+72.664
-1.07K%
jan 1, 1976
10.52
-55.347
-84.03%
jan 1, 1977
52.695
+42.175
400.92%
jan 1, 1978
-12.717
-65.412
-124.13%
jan 1, 1979
-20.544
-7.828
61.55%
jan 1, 1980
-6.473
+14.071
-68.49%
jan 1, 1981
1.272
+7.745
-119.65%
jan 1, 1982
23.495
+22.223
1.75K%
jan 1, 1983
19.076
-4.419
-18.81%
jan 1, 1984
-2.69
-21.766
-114.1%
jan 1, 1985
-5.582
-2.892
107.5%
jan 1, 1986
0.996
+6.578
-117.84%
jan 1, 1987
13.467
+12.471
1.25K%
jan 1, 1988
-11.864
-25.33
-188.09%
jan 1, 1989
-9.032
+2.832
-23.87%
jan 1, 1990
-7.313
+1.719
-19.04%
jan 1, 1991
4.809
+12.121
-165.76%
jan 1, 1992
-15.239
-20.047
-416.89%
jan 1, 1993
-15.239
0.0
0.0%
jan 1, 1994
-4.829
+10.41
-68.31%
jan 1, 1995
-4.829
+0.0
0.0%
jan 1, 1996
17.367
+22.195
-459.65%
jan 1, 1997
1.579
-15.788
-90.91%
jan 1, 1998
-6.148
-7.727
-489.31%
jan 1, 1999
6.325
+12.473
-202.89%
jan 1, 2000
5.935
-0.39
-6.16%
jan 1, 2001
24.301
+18.366
309.42%
jan 1, 2002
9.971
-14.331
-58.97%
jan 1, 2003
-5.411
-15.381
-154.27%
jan 1, 2004
26.034
+31.444
-581.15%
jan 1, 2005
51.677
+25.644
98.5%
jan 1, 2006
26.775
-24.902
-48.19%
jan 1, 2007
-19.179
-45.954
-171.63%
jan 1, 2008
12.198
+31.377
-163.6%
jan 1, 2009
12.172
-0.026
-0.21%
jan 1, 2010
-6.141
-18.313
-150.45%
jan 1, 2011
18.959
+25.101
-408.73%
jan 1, 2012
14.015
-4.944
-26.08%
jan 1, 2013
30.789
+16.774
119.68%
jan 1, 2014
-4.593
-35.382
-114.92%
Ranking of countries by current statistics by years


Comments: