29
/
en
AIzaSyAYiBZKx7MnpbEhh9jyipgxe19OcubqV5w
April 1, 2024
208056
Netherlands
NLD
true
2
1
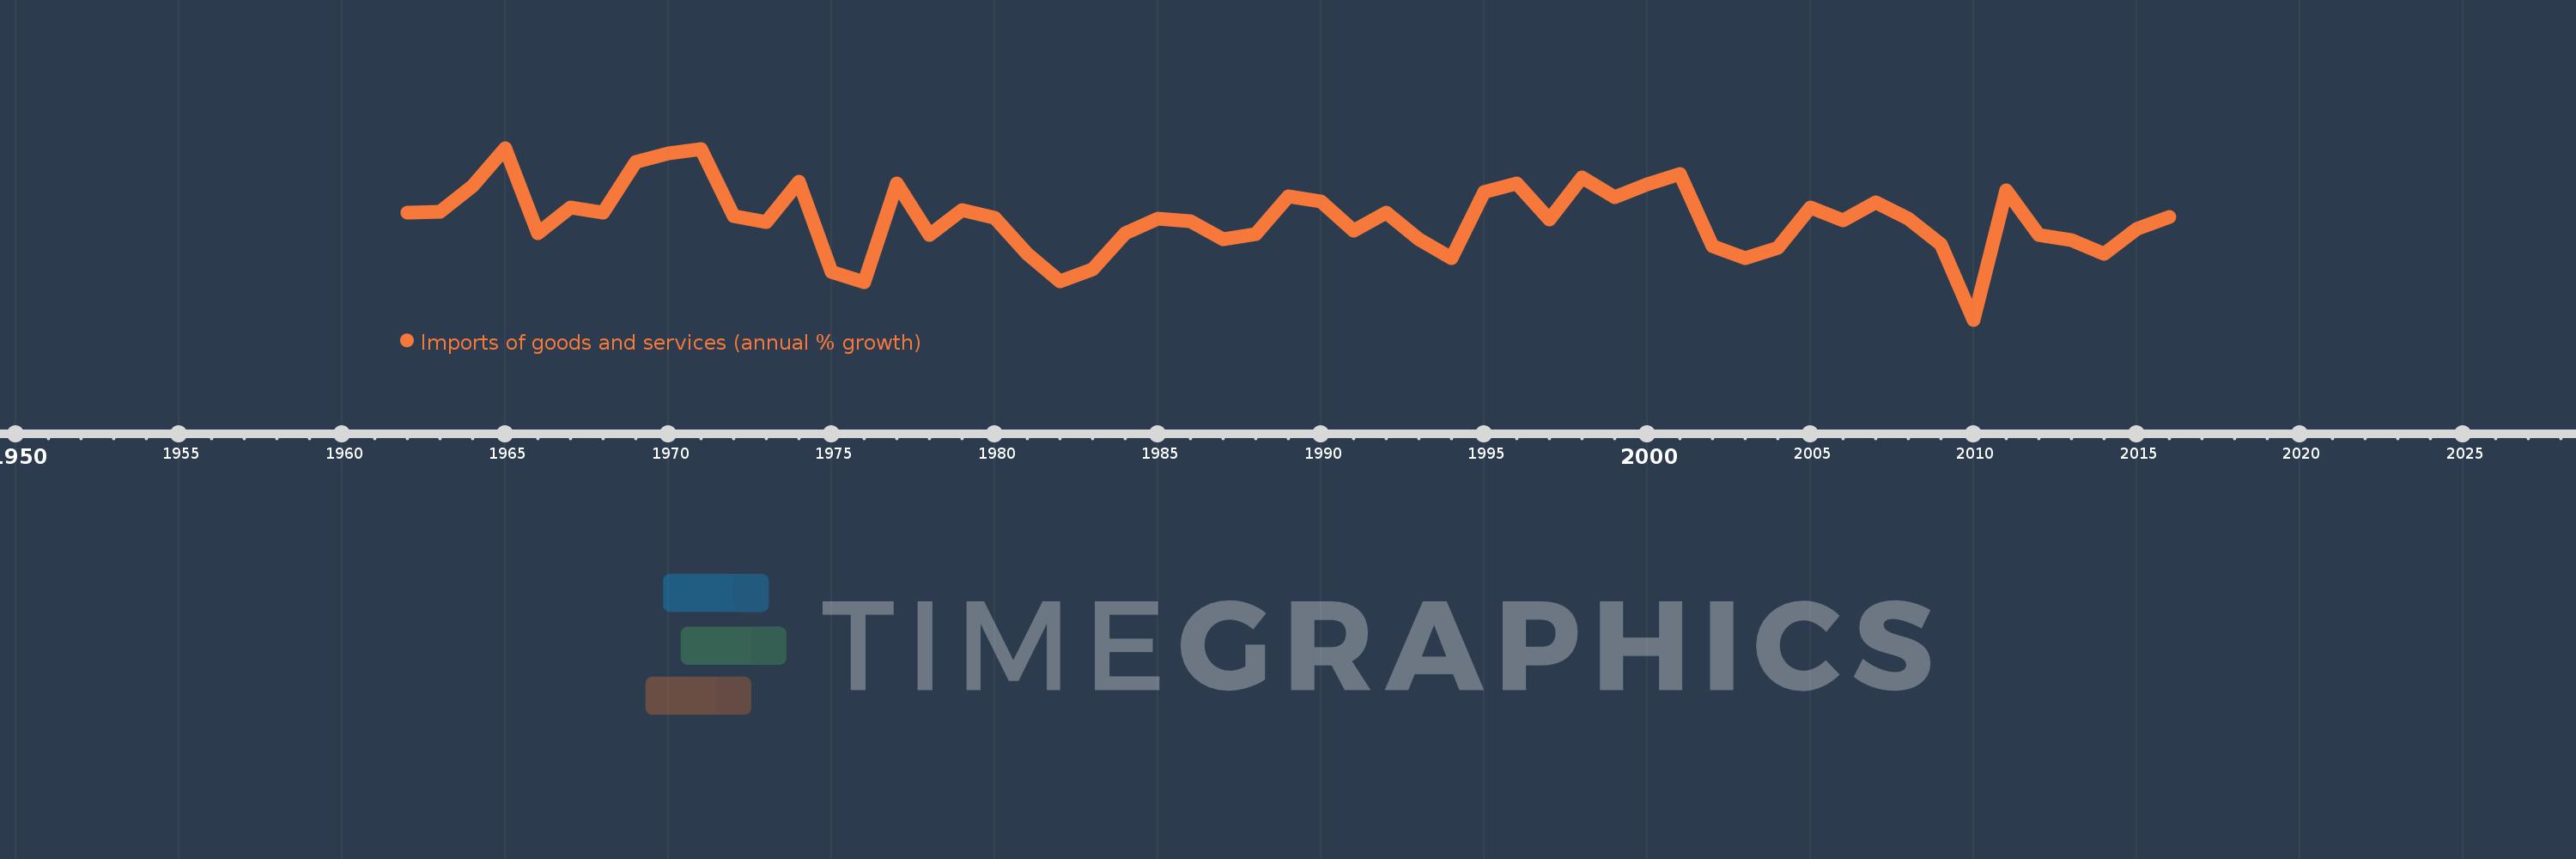
Imports of goods and services (annual % growth)
2016,2015,2014,2013,2012,2011,2010,2009,2008,2007,2006,2005,2004,2003,2002,2001,2000,1999,1998,1997,1996,1995,1994,1993,1992,1991,1990,1989,1988,1987,1986,1985,1984,1983,1982,1981,1980,1979,1978,1977,1976,1975,1974,1973,1972,1971,1970,1969,1968,1967,1966,1965,1964,1963,1962
This statistics in other country:
AlbaniaAlgeriaAngolaAntigua and BarbudaArab WorldArgentinaArmeniaAustraliaAustriaAzerbaijanBahamas, TheBahrainBangladeshBarbadosBelarusBelgiumBelizeBeninBhutanBoliviaBosnia and HerzegovinaBotswanaBrazilBrunei DarussalamBulgariaBurkina FasoBurundiCabo VerdeCambodiaCameroonCanadaCaribbean small statesCentral Europe and the BalticsChadChileColombiaComorosCongo, Dem. Rep.Congo, Rep.Costa RicaCote d'IvoireCroatiaCubaCyprusCzech RepublicDenmarkDjiboutiDominican RepublicEarly-demographic dividendEast Asia & PacificEcuadorEgypt, Arab Rep.El SalvadorEquatorial GuineaEritreaEstoniaEthiopiaEuro areaEurope & Central AsiaEurope & Central Asia (excluding high income)Europe & Central Asia (IDA & IBRD countries)European UnionFijiFinlandFranceGabonGambia, TheGeorgiaGermanyGhanaGreeceGuatemalaGuineaGuinea-BissauHaitiHeavily indebted poor countries (HIPC)High incomeHondurasHong Kong SAR, ChinaHungaryIBRD onlyIcelandIDA & IBRD totalIDA blendIDA onlyIDA totalIndiaIndonesiaIran, Islamic Rep.IrelandIsraelItalyJamaicaJapanJordanKazakhstanKenyaKorea, Rep.KosovoKuwaitKyrgyz RepublicLao PDRLatin America & Caribbean Latin America & Caribbean (excluding high income)Latin America & the Caribbean (IDA & IBRD countries)LatviaLeast developed countries: UN classificationLebanonLiberiaLibyaLithuaniaLow & middle incomeLow incomeLower middle incomeLuxembourgMacao SAR, ChinaMacedonia, FYRMadagascarMalawiMalaysiaMaliMaltaMauritaniaMauritiusMexicoMiddle East & North AfricaMiddle East & North Africa (excluding high income)Middle East & North Africa (IDA & IBRD countries)Middle incomeMoldovaMongoliaMontenegroMoroccoMozambiqueMyanmarNamibiaNepalNetherlandsNew ZealandNicaraguaNigerNigeriaNorth AmericaNorwayOECD membersOmanOther small statesPakistanPanamaPapua New GuineaParaguayPeruPhilippinesPolandPortugalPost-demographic dividendPre-demographic dividendPuerto RicoQatarRomaniaRussian FederationRwandaSamoaSaudi ArabiaSenegalSerbiaSeychellesSierra LeoneSingaporeSlovak RepublicSloveniaSmall statesSomaliaSouth AfricaSouth AsiaSouth Asia (IDA & IBRD)South SudanSpainSri LankaSub-Saharan Africa Sub-Saharan Africa (excluding high income)Sub-Saharan Africa (IDA & IBRD countries)SudanSurinameSwazilandSwedenSwitzerlandSyrian Arab RepublicTajikistanTanzaniaThailandTimor-LesteTogoTrinidad and TobagoTunisiaTurkeyTurkmenistanUgandaUkraineUnited Arab EmiratesUnited KingdomUnited StatesUruguayUzbekistanVanuatuVenezuela, RBVietnamWest Bank and GazaWorldZambiaZimbabwe Timeline:
This timeline shows a graph from 1962 to 2016 of Netherlands. No data until 1961. Number of actual observations by date: 55.
Source name:
World Development Indicators
Source organization:
World Bank national accounts data, and OECD National Accounts data files.
Categories, topics:
Economy & Growth, Trade
Last updated:
apr 23, 2017
Indicators value changes by year
Minimum:
-7.697
jan 1, 2010
Maximum:
14.859
jan 1, 1965
At the date of observation
Value
Absolute change
Change from previous value
jan 1, 1962
6.395
+6.395
0.0%
jan 1, 1963
6.451
+0.056
0.88%
jan 1, 1964
9.816
+3.365
52.16%
jan 1, 1965
14.859
+5.043
51.38%
jan 1, 1966
3.666
-11.193
-75.33%
jan 1, 1967
7.042
+3.377
92.12%
jan 1, 1968
6.346
-0.696
-9.89%
jan 1, 1969
13.02
+6.674
105.17%
jan 1, 1970
14.138
+1.118
8.58%
jan 1, 1971
14.682
+0.544
3.85%
jan 1, 1972
5.956
-8.725
-59.43%
jan 1, 1973
5.156
-0.8
-13.43%
jan 1, 1974
10.448
+5.292
102.63%
jan 1, 1975
-1.395
-11.843
-113.35%
jan 1, 1976
-2.761
-1.366
97.93%
jan 1, 1977
10.146
+12.907
-467.45%
jan 1, 1978
3.392
-6.754
-66.57%
jan 1, 1979
6.692
+3.299
97.26%
jan 1, 1980
5.698
-0.994
-14.85%
jan 1, 1981
0.98
-4.718
-82.8%
jan 1, 1982
-2.62
-3.6
-367.26%
jan 1, 1983
-1.077
+1.543
-58.9%
jan 1, 1984
3.701
+4.778
-443.73%
jan 1, 1985
5.554
+1.852
50.05%
jan 1, 1986
5.236
-0.317
-5.71%
jan 1, 1987
2.819
-2.418
-46.17%
jan 1, 1988
3.546
+0.727
25.8%
jan 1, 1989
8.548
+5.002
141.06%
jan 1, 1990
7.801
-0.747
-8.74%
jan 1, 1991
3.974
-3.827
-49.06%
jan 1, 1992
6.336
+2.362
59.44%
jan 1, 1993
2.852
-3.485
-54.99%
jan 1, 1994
0.394
-2.458
-86.18%
jan 1, 1995
9.034
+8.64
2.19K%
jan 1, 1996
10.159
+1.125
12.45%
jan 1, 1997
5.513
-4.645
-45.73%
jan 1, 1998
11.016
+5.503
99.81%
jan 1, 1999
8.407
-2.609
-23.69%
jan 1, 2000
10.113
+1.706
20.29%
jan 1, 2001
11.406
+1.293
12.79%
jan 1, 2002
1.996
-9.41
-82.5%
jan 1, 2003
0.418
-1.578
-79.04%
jan 1, 2004
1.745
+1.326
317.0%
jan 1, 2005
7.094
+5.349
306.63%
jan 1, 2006
5.337
-1.757
-24.77%
jan 1, 2007
7.764
+2.427
45.48%
jan 1, 2008
5.559
-2.205
-28.4%
jan 1, 2009
2.197
-3.361
-60.47%
jan 1, 2010
-7.697
-9.895
-450.29%
jan 1, 2011
9.314
+17.011
-221.0%
jan 1, 2012
3.489
-5.824
-62.53%
jan 1, 2013
2.704
-0.786
-22.51%
jan 1, 2014
0.972
-1.732
-64.04%
jan 1, 2015
4.208
+3.236
332.81%
jan 1, 2016
5.77
+1.562
37.12%
Ranking of countries by current statistics by years


Comments: