29
/
en
AIzaSyAYiBZKx7MnpbEhh9jyipgxe19OcubqV5w
April 1, 2024
213083
Nigeria
NGA
true
2
1
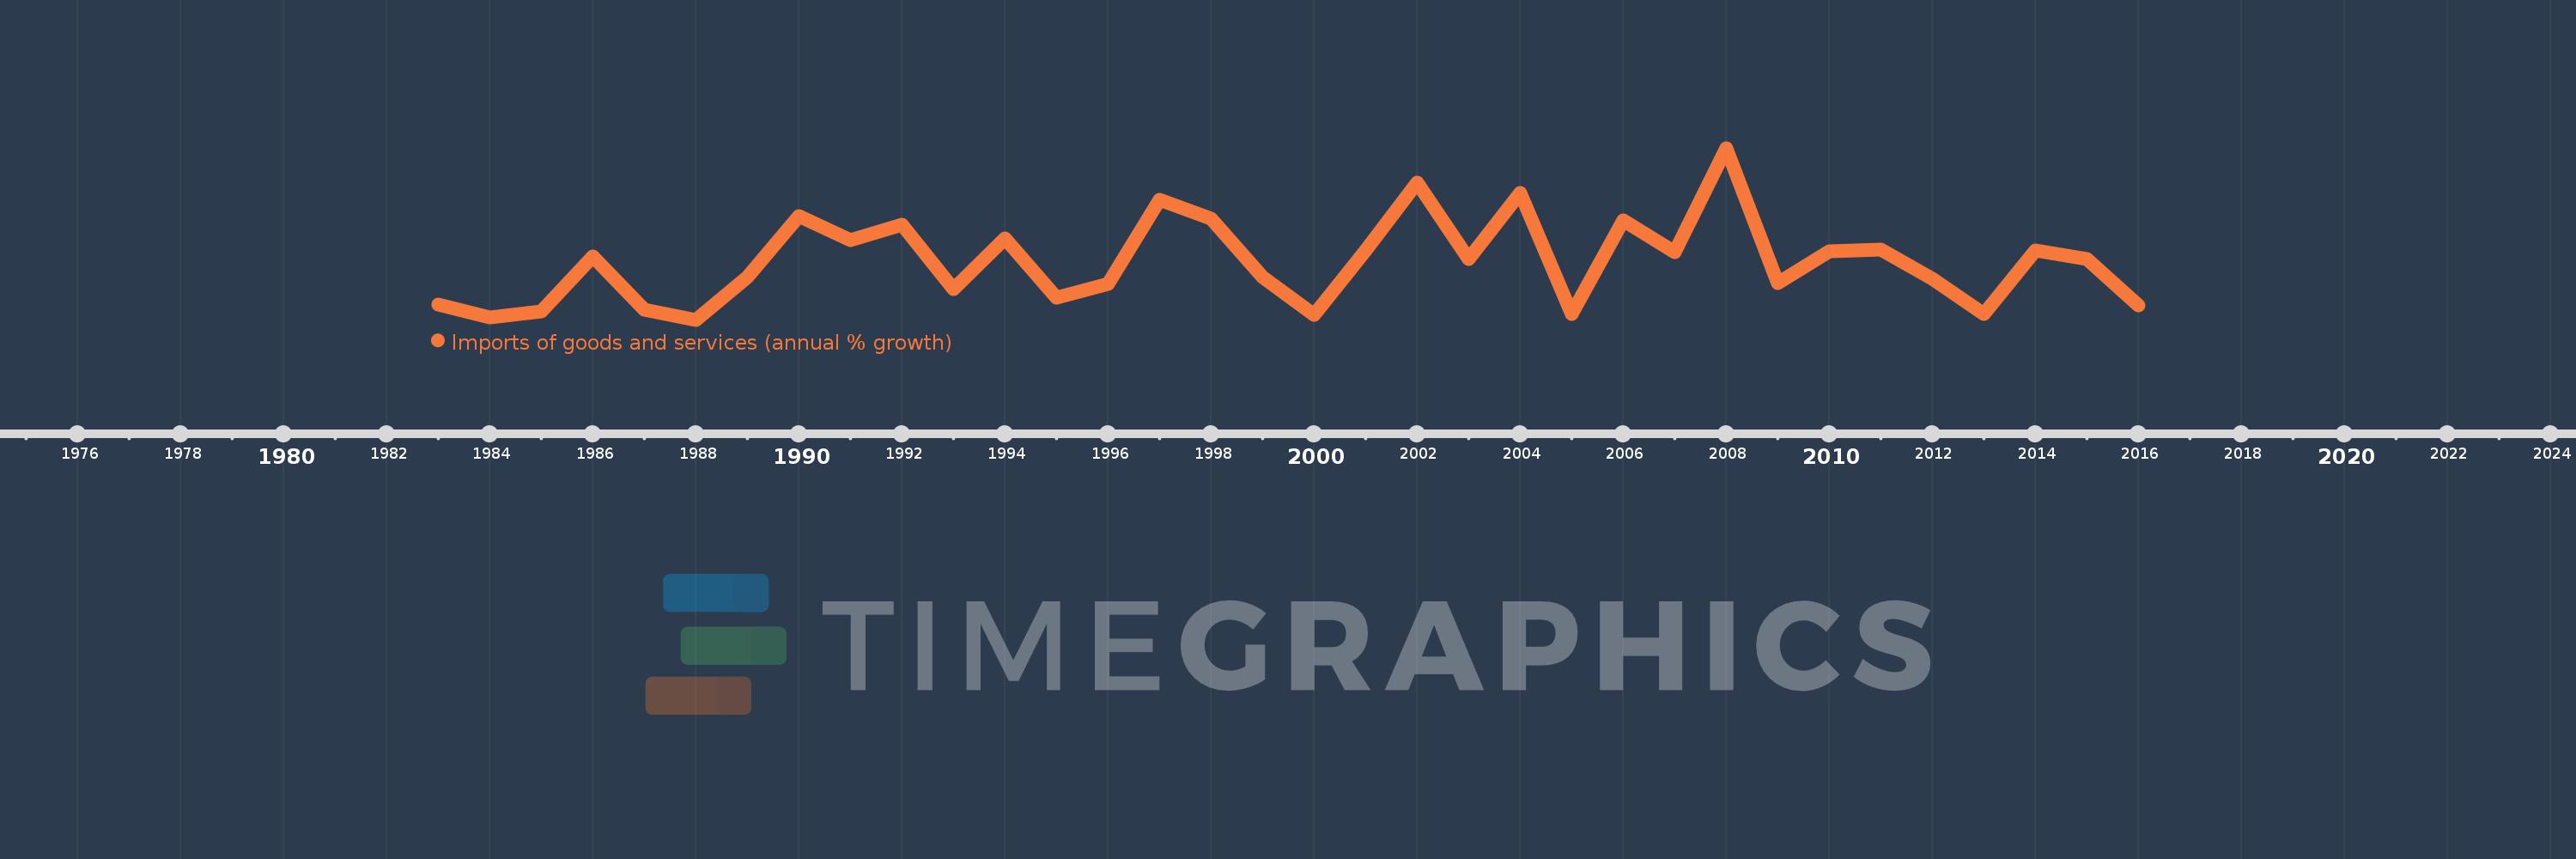
Imports of goods and services (annual % growth)
2016,2015,2014,2013,2012,2011,2010,2009,2008,2007,2006,2005,2004,2003,2002,2001,2000,1999,1998,1997,1996,1995,1994,1993,1992,1991,1990,1989,1988,1987,1986,1985,1984,1983
This statistics in other country:
AlbaniaAlgeriaAngolaAntigua and BarbudaArab WorldArgentinaArmeniaAustraliaAustriaAzerbaijanBahamas, TheBahrainBangladeshBarbadosBelarusBelgiumBelizeBeninBhutanBoliviaBosnia and HerzegovinaBotswanaBrazilBrunei DarussalamBulgariaBurkina FasoBurundiCabo VerdeCambodiaCameroonCanadaCaribbean small statesCentral Europe and the BalticsChadChileColombiaComorosCongo, Dem. Rep.Congo, Rep.Costa RicaCote d'IvoireCroatiaCubaCyprusCzech RepublicDenmarkDjiboutiDominican RepublicEarly-demographic dividendEast Asia & PacificEcuadorEgypt, Arab Rep.El SalvadorEquatorial GuineaEritreaEstoniaEthiopiaEuro areaEurope & Central AsiaEurope & Central Asia (excluding high income)Europe & Central Asia (IDA & IBRD countries)European UnionFijiFinlandFranceGabonGambia, TheGeorgiaGermanyGhanaGreeceGuatemalaGuineaGuinea-BissauHaitiHeavily indebted poor countries (HIPC)High incomeHondurasHong Kong SAR, ChinaHungaryIBRD onlyIcelandIDA & IBRD totalIDA blendIDA onlyIDA totalIndiaIndonesiaIran, Islamic Rep.IrelandIsraelItalyJamaicaJapanJordanKazakhstanKenyaKorea, Rep.KosovoKuwaitKyrgyz RepublicLao PDRLatin America & Caribbean Latin America & Caribbean (excluding high income)Latin America & the Caribbean (IDA & IBRD countries)LatviaLeast developed countries: UN classificationLebanonLiberiaLibyaLithuaniaLow & middle incomeLow incomeLower middle incomeLuxembourgMacao SAR, ChinaMacedonia, FYRMadagascarMalawiMalaysiaMaliMaltaMauritaniaMauritiusMexicoMiddle East & North AfricaMiddle East & North Africa (excluding high income)Middle East & North Africa (IDA & IBRD countries)Middle incomeMoldovaMongoliaMontenegroMoroccoMozambiqueMyanmarNamibiaNepalNetherlandsNew ZealandNicaraguaNigerNigeriaNorth AmericaNorwayOECD membersOmanOther small statesPakistanPanamaPapua New GuineaParaguayPeruPhilippinesPolandPortugalPost-demographic dividendPre-demographic dividendPuerto RicoQatarRomaniaRussian FederationRwandaSamoaSaudi ArabiaSenegalSerbiaSeychellesSierra LeoneSingaporeSlovak RepublicSloveniaSmall statesSomaliaSouth AfricaSouth AsiaSouth Asia (IDA & IBRD)South SudanSpainSri LankaSub-Saharan Africa Sub-Saharan Africa (excluding high income)Sub-Saharan Africa (IDA & IBRD countries)SudanSurinameSwazilandSwedenSwitzerlandSyrian Arab RepublicTajikistanTanzaniaThailandTimor-LesteTogoTrinidad and TobagoTunisiaTurkeyTurkmenistanUgandaUkraineUnited Arab EmiratesUnited KingdomUnited StatesUruguayUzbekistanVanuatuVenezuela, RBVietnamWest Bank and GazaWorldZambiaZimbabwe Timeline:
This timeline shows a graph from 1983 to 2016 of Nigeria. No data until 1982. Number of actual observations by date: 34.
Source name:
World Development Indicators
Source organization:
World Bank national accounts data, and OECD National Accounts data files.
Categories, topics:
Economy & Growth, Trade
Last updated:
apr 23, 2017
Indicators value changes by year
Minimum:
-37.143
jan 1, 1988
Maximum:
85.514
jan 1, 2008
At the date of observation
Value
Absolute change
Change from previous value
jan 1, 1983
-26.067
-26.067
0.0%
jan 1, 1984
-35.266
-9.199
35.29%
jan 1, 1985
-30.896
+4.37
-12.39%
jan 1, 1986
7.853
+38.749
-125.42%
jan 1, 1987
-30.068
-37.921
-482.89%
jan 1, 1988
-37.143
-7.075
23.53%
jan 1, 1989
-6.601
+30.542
-82.23%
jan 1, 1990
36.753
+43.354
-656.75%
jan 1, 1991
19.557
-17.196
-46.79%
jan 1, 1992
30.546
+10.989
56.19%
jan 1, 1993
-14.973
-45.519
-149.02%
jan 1, 1994
20.837
+35.81
-239.17%
jan 1, 1995
-21.6
-42.437
-203.66%
jan 1, 1996
-11.874
+9.726
-45.03%
jan 1, 1997
48.808
+60.683
-511.05%
jan 1, 1998
34.827
-13.982
-28.65%
jan 1, 1999
-6.538
-41.365
-118.77%
jan 1, 2000
-33.703
-27.165
415.51%
jan 1, 2001
12.575
+46.278
-137.31%
jan 1, 2002
60.889
+48.314
384.2%
jan 1, 2003
6.353
-54.536
-89.57%
jan 1, 2004
53.445
+47.092
741.21%
jan 1, 2005
-33.214
-86.659
-162.15%
jan 1, 2006
33.619
+66.833
-201.22%
jan 1, 2007
10.817
-22.802
-67.82%
jan 1, 2008
85.514
+74.697
690.53%
jan 1, 2009
-11.259
-96.773
-113.17%
jan 1, 2010
11.679
+22.938
-203.73%
jan 1, 2011
12.665
+0.986
8.45%
jan 1, 2012
-7.833
-20.499
-161.85%
jan 1, 2013
-32.892
-25.058
319.89%
jan 1, 2014
12.216
+45.107
-137.14%
jan 1, 2015
5.969
-6.247
-51.14%
jan 1, 2016
-26.821
-32.791
-549.33%
Ranking of countries by current statistics by years


Comments: