29
/
en
AIzaSyAYiBZKx7MnpbEhh9jyipgxe19OcubqV5w
April 1, 2024
205386
Namibia
NAM
true
2
1
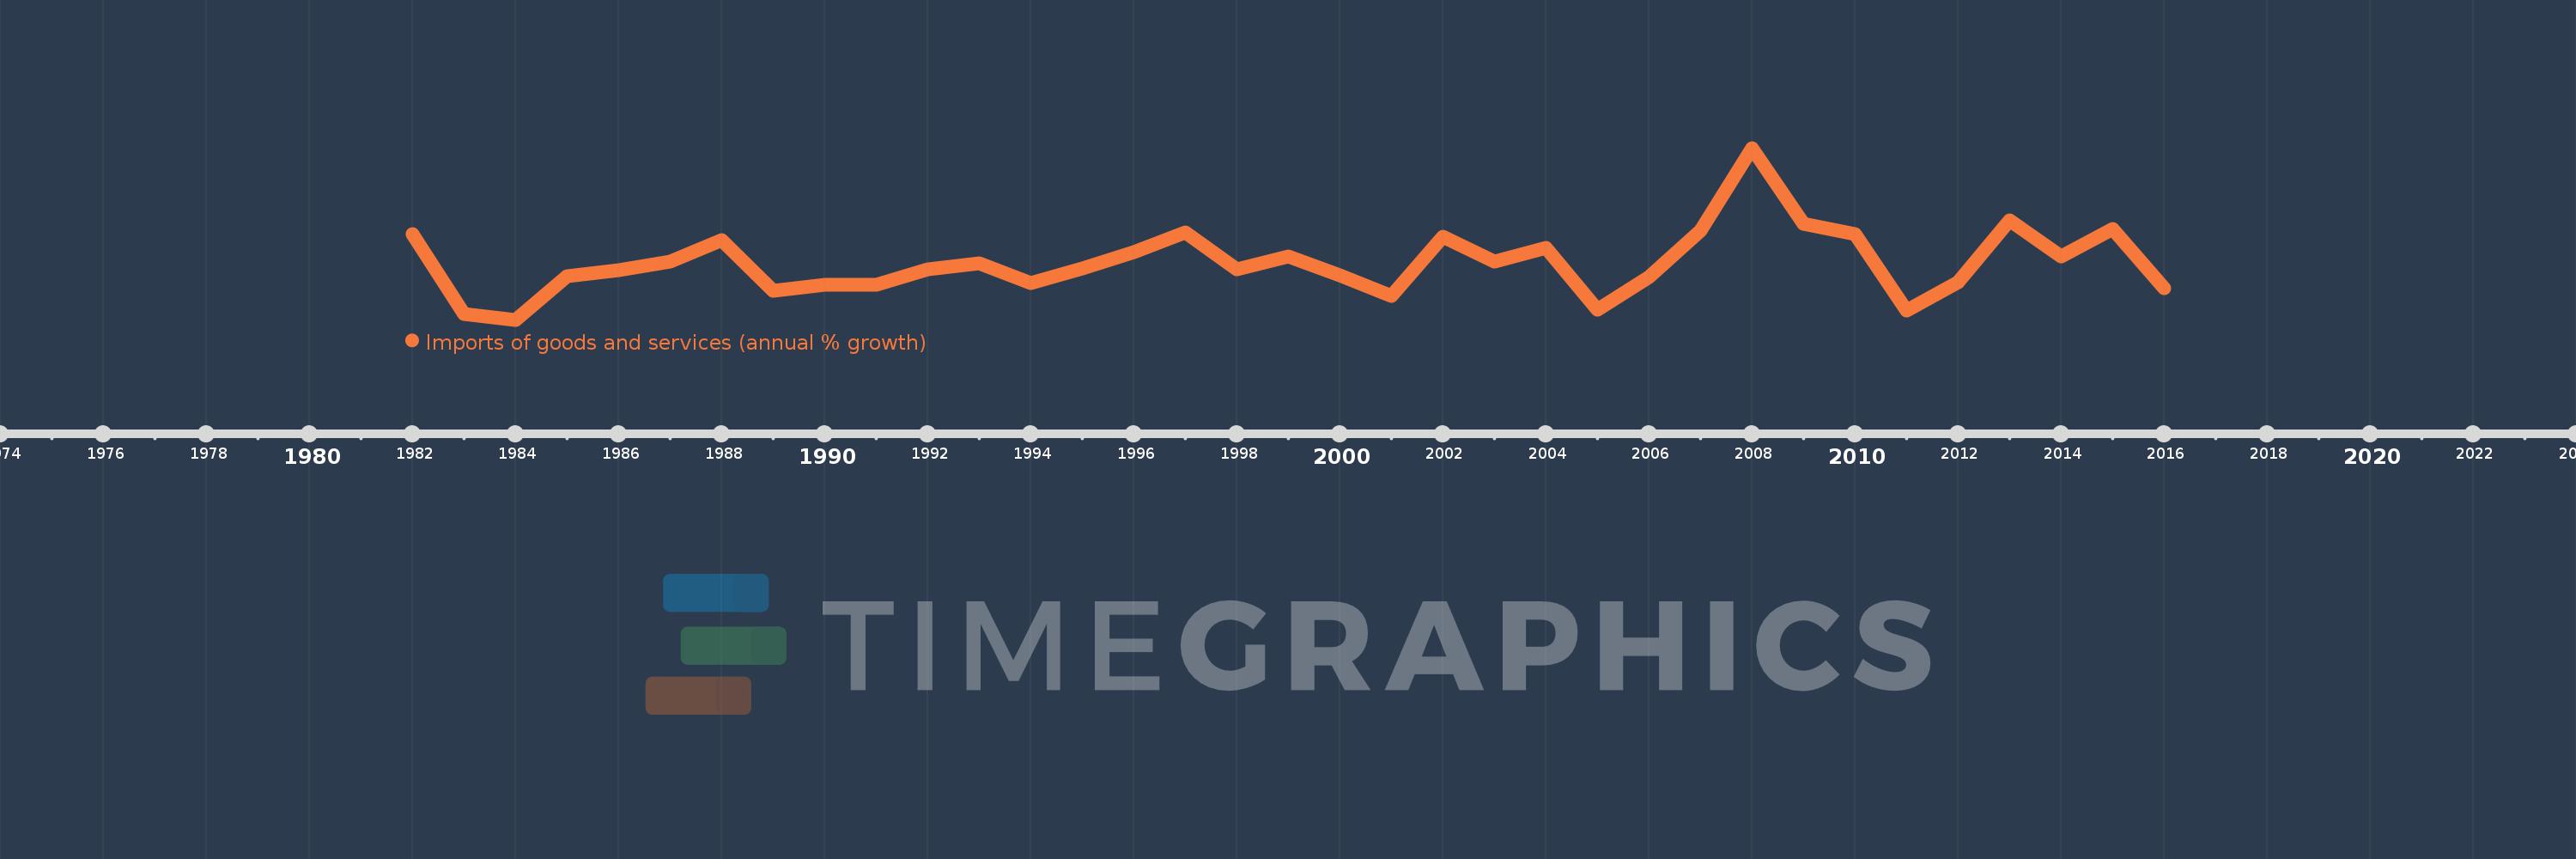
Imports of goods and services (annual % growth)
2016,2015,2014,2013,2012,2011,2010,2009,2008,2007,2006,2005,2004,2003,2002,2001,2000,1999,1998,1997,1996,1995,1994,1993,1992,1991,1990,1989,1988,1987,1986,1985,1984,1983,1982
This statistics in other country:
AlbaniaAlgeriaAngolaAntigua and BarbudaArab WorldArgentinaArmeniaAustraliaAustriaAzerbaijanBahamas, TheBahrainBangladeshBarbadosBelarusBelgiumBelizeBeninBhutanBoliviaBosnia and HerzegovinaBotswanaBrazilBrunei DarussalamBulgariaBurkina FasoBurundiCabo VerdeCambodiaCameroonCanadaCaribbean small statesCentral Europe and the BalticsChadChileColombiaComorosCongo, Dem. Rep.Congo, Rep.Costa RicaCote d'IvoireCroatiaCubaCyprusCzech RepublicDenmarkDjiboutiDominican RepublicEarly-demographic dividendEast Asia & PacificEcuadorEgypt, Arab Rep.El SalvadorEquatorial GuineaEritreaEstoniaEthiopiaEuro areaEurope & Central AsiaEurope & Central Asia (excluding high income)Europe & Central Asia (IDA & IBRD countries)European UnionFijiFinlandFranceGabonGambia, TheGeorgiaGermanyGhanaGreeceGuatemalaGuineaGuinea-BissauHaitiHeavily indebted poor countries (HIPC)High incomeHondurasHong Kong SAR, ChinaHungaryIBRD onlyIcelandIDA & IBRD totalIDA blendIDA onlyIDA totalIndiaIndonesiaIran, Islamic Rep.IrelandIsraelItalyJamaicaJapanJordanKazakhstanKenyaKorea, Rep.KosovoKuwaitKyrgyz RepublicLao PDRLatin America & Caribbean Latin America & Caribbean (excluding high income)Latin America & the Caribbean (IDA & IBRD countries)LatviaLeast developed countries: UN classificationLebanonLiberiaLibyaLithuaniaLow & middle incomeLow incomeLower middle incomeLuxembourgMacao SAR, ChinaMacedonia, FYRMadagascarMalawiMalaysiaMaliMaltaMauritaniaMauritiusMexicoMiddle East & North AfricaMiddle East & North Africa (excluding high income)Middle East & North Africa (IDA & IBRD countries)Middle incomeMoldovaMongoliaMontenegroMoroccoMozambiqueMyanmarNamibiaNepalNetherlandsNew ZealandNicaraguaNigerNigeriaNorth AmericaNorwayOECD membersOmanOther small statesPakistanPanamaPapua New GuineaParaguayPeruPhilippinesPolandPortugalPost-demographic dividendPre-demographic dividendPuerto RicoQatarRomaniaRussian FederationRwandaSamoaSaudi ArabiaSenegalSerbiaSeychellesSierra LeoneSingaporeSlovak RepublicSloveniaSmall statesSomaliaSouth AfricaSouth AsiaSouth Asia (IDA & IBRD)South SudanSpainSri LankaSub-Saharan Africa Sub-Saharan Africa (excluding high income)Sub-Saharan Africa (IDA & IBRD countries)SudanSurinameSwazilandSwedenSwitzerlandSyrian Arab RepublicTajikistanTanzaniaThailandTimor-LesteTogoTrinidad and TobagoTunisiaTurkeyTurkmenistanUgandaUkraineUnited Arab EmiratesUnited KingdomUnited StatesUruguayUzbekistanVanuatuVenezuela, RBVietnamWest Bank and GazaWorldZambiaZimbabwe Timeline:
This timeline shows a graph from 1982 to 2016 of Namibia. No data until 1981. Number of actual observations by date: 35.
Source name:
World Development Indicators
Source organization:
World Bank national accounts data, and OECD National Accounts data files.
Categories, topics:
Economy & Growth, Trade
Last updated:
apr 23, 2017
Indicators value changes by year
Minimum:
-13.142
jan 1, 1984
Maximum:
43.581
jan 1, 2008
At the date of observation
Value
Absolute change
Change from previous value
jan 1, 1982
15.145
+15.145
0.0%
jan 1, 1983
-11.168
-26.313
-173.74%
jan 1, 1984
-13.142
-1.974
17.68%
jan 1, 1985
1.22
+14.362
-109.28%
jan 1, 1986
3.116
+1.896
155.4%
jan 1, 1987
6.158
+3.042
97.62%
jan 1, 1988
13.029
+6.871
111.57%
jan 1, 1989
-3.636
-16.665
-127.9%
jan 1, 1990
-1.508
+2.128
-58.53%
jan 1, 1991
-1.619
-0.112
7.4%
jan 1, 1992
3.535
+5.154
-318.29%
jan 1, 1993
5.388
+1.853
52.41%
jan 1, 1994
-0.982
-6.369
-118.22%
jan 1, 1995
3.743
+4.724
-481.25%
jan 1, 1996
9.132
+5.389
143.99%
jan 1, 1997
15.716
+6.585
72.11%
jan 1, 1998
3.43
-12.286
-78.18%
jan 1, 1999
7.651
+4.221
123.06%
jan 1, 2000
1.394
-6.256
-81.77%
jan 1, 2001
-5.207
-6.602
-473.47%
jan 1, 2002
14.271
+19.478
-374.05%
jan 1, 2003
6.151
-8.12
-56.9%
jan 1, 2004
10.506
+4.355
70.8%
jan 1, 2005
-9.949
-20.455
-194.7%
jan 1, 2006
0.926
+10.875
-109.3%
jan 1, 2007
16.321
+15.395
1.66K%
jan 1, 2008
43.581
+27.261
167.03%
jan 1, 2009
18.67
-24.911
-57.16%
jan 1, 2010
15.117
-3.553
-19.03%
jan 1, 2011
-10.246
-25.363
-167.78%
jan 1, 2012
-0.729
+9.517
-92.89%
jan 1, 2013
19.604
+20.332
-2.79K%
jan 1, 2014
7.673
-11.931
-60.86%
jan 1, 2015
16.824
+9.151
119.27%
jan 1, 2016
-2.61
-19.434
-115.51%
Ranking of countries by current statistics by years


Comments: