29
/
en
AIzaSyAYiBZKx7MnpbEhh9jyipgxe19OcubqV5w
April 1, 2024
210496
Nicaragua
NIC
true
2
1
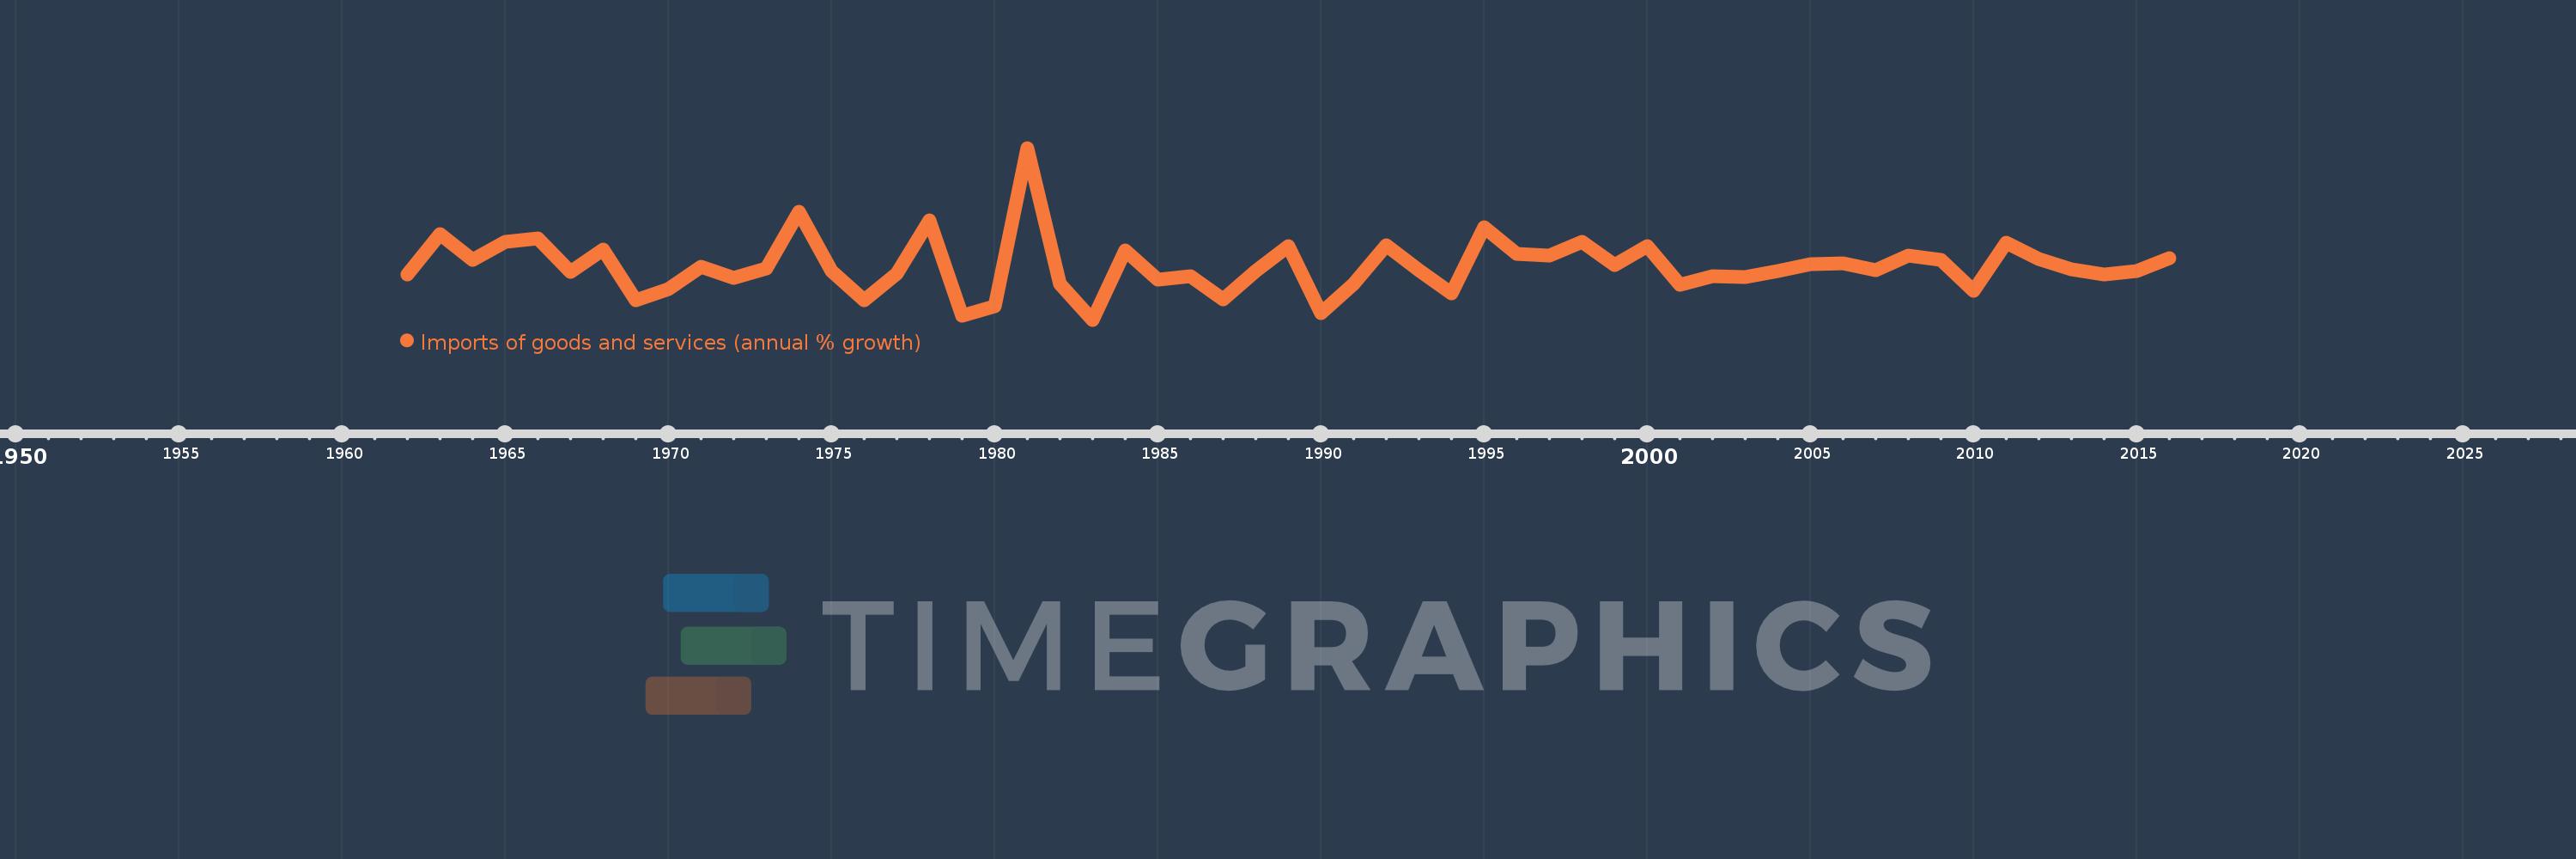
Imports of goods and services (annual % growth)
2016,2015,2014,2013,2012,2011,2010,2009,2008,2007,2006,2005,2004,2003,2002,2001,2000,1999,1998,1997,1996,1995,1994,1993,1992,1991,1990,1989,1988,1987,1986,1985,1984,1983,1982,1981,1980,1979,1978,1977,1976,1975,1974,1973,1972,1971,1970,1969,1968,1967,1966,1965,1964,1963,1962
This statistics in other country:
AlbaniaAlgeriaAngolaAntigua and BarbudaArab WorldArgentinaArmeniaAustraliaAustriaAzerbaijanBahamas, TheBahrainBangladeshBarbadosBelarusBelgiumBelizeBeninBhutanBoliviaBosnia and HerzegovinaBotswanaBrazilBrunei DarussalamBulgariaBurkina FasoBurundiCabo VerdeCambodiaCameroonCanadaCaribbean small statesCentral Europe and the BalticsChadChileColombiaComorosCongo, Dem. Rep.Congo, Rep.Costa RicaCote d'IvoireCroatiaCubaCyprusCzech RepublicDenmarkDjiboutiDominican RepublicEarly-demographic dividendEast Asia & PacificEcuadorEgypt, Arab Rep.El SalvadorEquatorial GuineaEritreaEstoniaEthiopiaEuro areaEurope & Central AsiaEurope & Central Asia (excluding high income)Europe & Central Asia (IDA & IBRD countries)European UnionFijiFinlandFranceGabonGambia, TheGeorgiaGermanyGhanaGreeceGuatemalaGuineaGuinea-BissauHaitiHeavily indebted poor countries (HIPC)High incomeHondurasHong Kong SAR, ChinaHungaryIBRD onlyIcelandIDA & IBRD totalIDA blendIDA onlyIDA totalIndiaIndonesiaIran, Islamic Rep.IrelandIsraelItalyJamaicaJapanJordanKazakhstanKenyaKorea, Rep.KosovoKuwaitKyrgyz RepublicLao PDRLatin America & Caribbean Latin America & Caribbean (excluding high income)Latin America & the Caribbean (IDA & IBRD countries)LatviaLeast developed countries: UN classificationLebanonLiberiaLibyaLithuaniaLow & middle incomeLow incomeLower middle incomeLuxembourgMacao SAR, ChinaMacedonia, FYRMadagascarMalawiMalaysiaMaliMaltaMauritaniaMauritiusMexicoMiddle East & North AfricaMiddle East & North Africa (excluding high income)Middle East & North Africa (IDA & IBRD countries)Middle incomeMoldovaMongoliaMontenegroMoroccoMozambiqueMyanmarNamibiaNepalNetherlandsNew ZealandNicaraguaNigerNigeriaNorth AmericaNorwayOECD membersOmanOther small statesPakistanPanamaPapua New GuineaParaguayPeruPhilippinesPolandPortugalPost-demographic dividendPre-demographic dividendPuerto RicoQatarRomaniaRussian FederationRwandaSamoaSaudi ArabiaSenegalSerbiaSeychellesSierra LeoneSingaporeSlovak RepublicSloveniaSmall statesSomaliaSouth AfricaSouth AsiaSouth Asia (IDA & IBRD)South SudanSpainSri LankaSub-Saharan Africa Sub-Saharan Africa (excluding high income)Sub-Saharan Africa (IDA & IBRD countries)SudanSurinameSwazilandSwedenSwitzerlandSyrian Arab RepublicTajikistanTanzaniaThailandTimor-LesteTogoTrinidad and TobagoTunisiaTurkeyTurkmenistanUgandaUkraineUnited Arab EmiratesUnited KingdomUnited StatesUruguayUzbekistanVanuatuVenezuela, RBVietnamWest Bank and GazaWorldZambiaZimbabwe Timeline:
This timeline shows a graph from 1962 to 2016 of Nicaragua. No data until 1961. Number of actual observations by date: 55.
Source name:
World Development Indicators
Source organization:
World Bank national accounts data, and OECD National Accounts data files.
Categories, topics:
Economy & Growth, Trade
Last updated:
apr 23, 2017
Indicators value changes by year
Minimum:
-27.127
jan 1, 1983
Maximum:
81.602
jan 1, 1981
At the date of observation
Value
Absolute change
Change from previous value
jan 1, 1962
1.429
+1.429
0.0%
jan 1, 1963
27.23
+25.801
1.81K%
jan 1, 1964
10.947
-16.283
-59.8%
jan 1, 1965
22.395
+11.448
104.57%
jan 1, 1966
24.366
+1.971
8.8%
jan 1, 1967
3.164
-21.202
-87.02%
jan 1, 1968
17.401
+14.237
450.0%
jan 1, 1969
-14.954
-32.354
-185.94%
jan 1, 1970
-7.825
+7.128
-47.67%
jan 1, 1971
6.546
+14.371
-183.65%
jan 1, 1972
-0.712
-7.257
-110.87%
jan 1, 1973
5.291
+6.003
-843.54%
jan 1, 1974
41.302
+36.011
680.61%
jan 1, 1975
3.824
-37.479
-90.74%
jan 1, 1976
-15.042
-18.866
-493.41%
jan 1, 1977
1.9
+16.943
-112.63%
jan 1, 1978
35.8
+33.899
1.78K%
jan 1, 1979
-24.515
-60.315
-168.48%
jan 1, 1980
-18.78
+5.735
-23.4%
jan 1, 1981
81.602
+100.382
-534.53%
jan 1, 1982
-4.401
-86.004
-105.39%
jan 1, 1983
-27.127
-22.726
516.32%
jan 1, 1984
16.802
+43.929
-161.94%
jan 1, 1985
-1.525
-18.328
-109.08%
jan 1, 1986
0.58
+2.105
-138.0%
jan 1, 1987
-14.347
-14.927
-2.58K%
jan 1, 1988
3.5
+17.847
-124.39%
jan 1, 1989
19.352
+15.853
453.0%
jan 1, 1990
-22.892
-42.244
-218.29%
jan 1, 1991
-4.551
+18.341
-80.12%
jan 1, 1992
19.752
+24.303
-534.01%
jan 1, 1993
4.28
-15.472
-78.33%
jan 1, 1994
-10.456
-14.737
-344.29%
jan 1, 1995
31.569
+42.025
-401.91%
jan 1, 1996
14.371
-17.198
-54.48%
jan 1, 1997
13.603
-0.768
-5.34%
jan 1, 1998
22.257
+8.653
63.61%
jan 1, 1999
7.62
-14.637
-65.76%
jan 1, 2000
19.451
+11.831
155.26%
jan 1, 2001
-4.745
-24.195
-124.39%
jan 1, 2002
0.697
+5.442
-114.7%
jan 1, 2003
-0.137
-0.835
-119.69%
jan 1, 2004
3.489
+3.626
-2.64K%
jan 1, 2005
8.19
+4.701
134.74%
jan 1, 2006
8.6
+0.41
5.0%
jan 1, 2007
4.44
-4.16
-48.37%
jan 1, 2008
13.35
+8.91
200.68%
jan 1, 2009
10.602
-2.748
-20.59%
jan 1, 2010
-8.907
-19.509
-184.02%
jan 1, 2011
21.718
+30.625
-343.82%
jan 1, 2012
11.072
-10.646
-49.02%
jan 1, 2013
4.755
-6.317
-57.05%
jan 1, 2014
1.499
-3.256
-68.47%
jan 1, 2015
3.49
+1.99
132.73%
jan 1, 2016
11.595
+8.106
232.28%
Ranking of countries by current statistics by years


Comments: