29
/
en
AIzaSyAYiBZKx7MnpbEhh9jyipgxe19OcubqV5w
April 1, 2024
81864
Belgium
BEL
true
2
1
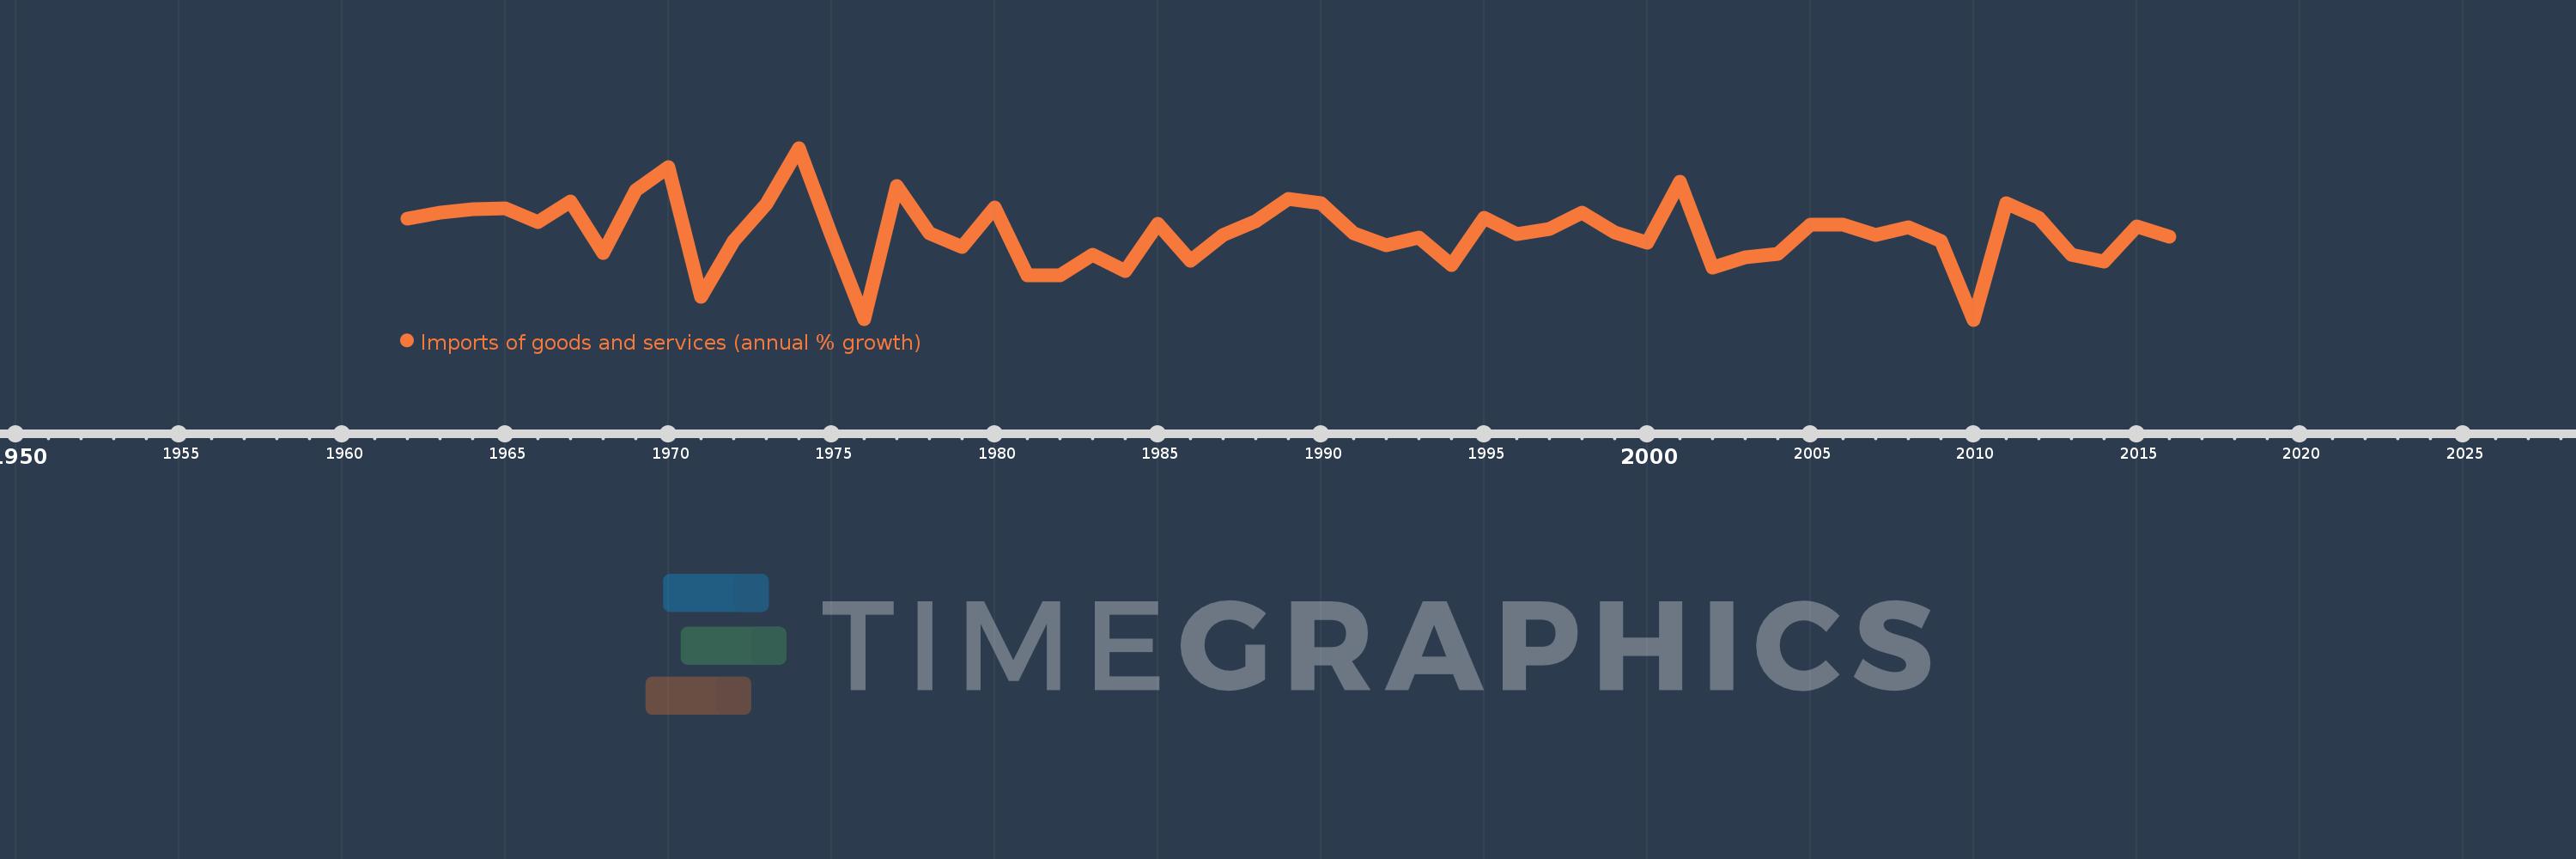
Imports of goods and services (annual % growth)
2016,2015,2014,2013,2012,2011,2010,2009,2008,2007,2006,2005,2004,2003,2002,2001,2000,1999,1998,1997,1996,1995,1994,1993,1992,1991,1990,1989,1988,1987,1986,1985,1984,1983,1982,1981,1980,1979,1978,1977,1976,1975,1974,1973,1972,1971,1970,1969,1968,1967,1966,1965,1964,1963,1962
This statistics in other country:
AlbaniaAlgeriaAngolaAntigua and BarbudaArab WorldArgentinaArmeniaAustraliaAustriaAzerbaijanBahamas, TheBahrainBangladeshBarbadosBelarusBelgiumBelizeBeninBhutanBoliviaBosnia and HerzegovinaBotswanaBrazilBrunei DarussalamBulgariaBurkina FasoBurundiCabo VerdeCambodiaCameroonCanadaCaribbean small statesCentral Europe and the BalticsChadChileColombiaComorosCongo, Dem. Rep.Congo, Rep.Costa RicaCote d'IvoireCroatiaCubaCyprusCzech RepublicDenmarkDjiboutiDominican RepublicEarly-demographic dividendEast Asia & PacificEcuadorEgypt, Arab Rep.El SalvadorEquatorial GuineaEritreaEstoniaEthiopiaEuro areaEurope & Central AsiaEurope & Central Asia (excluding high income)Europe & Central Asia (IDA & IBRD countries)European UnionFijiFinlandFranceGabonGambia, TheGeorgiaGermanyGhanaGreeceGuatemalaGuineaGuinea-BissauHaitiHeavily indebted poor countries (HIPC)High incomeHondurasHong Kong SAR, ChinaHungaryIBRD onlyIcelandIDA & IBRD totalIDA blendIDA onlyIDA totalIndiaIndonesiaIran, Islamic Rep.IrelandIsraelItalyJamaicaJapanJordanKazakhstanKenyaKorea, Rep.KosovoKuwaitKyrgyz RepublicLao PDRLatin America & Caribbean Latin America & Caribbean (excluding high income)Latin America & the Caribbean (IDA & IBRD countries)LatviaLeast developed countries: UN classificationLebanonLiberiaLibyaLithuaniaLow & middle incomeLow incomeLower middle incomeLuxembourgMacao SAR, ChinaMacedonia, FYRMadagascarMalawiMalaysiaMaliMaltaMauritaniaMauritiusMexicoMiddle East & North AfricaMiddle East & North Africa (excluding high income)Middle East & North Africa (IDA & IBRD countries)Middle incomeMoldovaMongoliaMontenegroMoroccoMozambiqueMyanmarNamibiaNepalNetherlandsNew ZealandNicaraguaNigerNigeriaNorth AmericaNorwayOECD membersOmanOther small statesPakistanPanamaPapua New GuineaParaguayPeruPhilippinesPolandPortugalPost-demographic dividendPre-demographic dividendPuerto RicoQatarRomaniaRussian FederationRwandaSamoaSaudi ArabiaSenegalSerbiaSeychellesSierra LeoneSingaporeSlovak RepublicSloveniaSmall statesSomaliaSouth AfricaSouth AsiaSouth Asia (IDA & IBRD)South SudanSpainSri LankaSub-Saharan Africa Sub-Saharan Africa (excluding high income)Sub-Saharan Africa (IDA & IBRD countries)SudanSurinameSwazilandSwedenSwitzerlandSyrian Arab RepublicTajikistanTanzaniaThailandTimor-LesteTogoTrinidad and TobagoTunisiaTurkeyTurkmenistanUgandaUkraineUnited Arab EmiratesUnited KingdomUnited StatesUruguayUzbekistanVanuatuVenezuela, RBVietnamWest Bank and GazaWorldZambiaZimbabwe Timeline:
This timeline shows a graph from 1962 to 2016 of Belgium. No data until 1961. Number of actual observations by date: 55.
Source name:
World Development Indicators
Source organization:
World Bank national accounts data, and OECD National Accounts data files.
Categories, topics:
Economy & Growth, Trade
Last updated:
apr 23, 2017
Indicators value changes by year
Minimum:
-9.115
jan 1, 2010
Maximum:
18.587
jan 1, 1974
At the date of observation
Value
Absolute change
Change from previous value
jan 1, 1962
7.197
+7.197
0.0%
jan 1, 1963
8.206
+1.009
14.02%
jan 1, 1964
8.649
+0.443
5.4%
jan 1, 1965
8.855
+0.205
2.38%
jan 1, 1966
6.571
-2.284
-25.79%
jan 1, 1967
9.921
+3.349
50.97%
jan 1, 1968
1.584
-8.337
-84.03%
jan 1, 1969
11.712
+10.128
639.47%
jan 1, 1970
15.487
+3.775
32.23%
jan 1, 1971
-5.445
-20.932
-135.16%
jan 1, 1972
3.645
+9.089
-166.94%
jan 1, 1973
9.569
+5.925
162.56%
jan 1, 1974
18.587
+9.017
94.24%
jan 1, 1975
4.416
-14.17
-76.24%
jan 1, 1976
-9.082
-13.499
-305.65%
jan 1, 1977
12.386
+21.468
-236.37%
jan 1, 1978
4.771
-7.615
-61.48%
jan 1, 1979
2.668
-2.103
-44.07%
jan 1, 1980
8.956
+6.288
235.64%
jan 1, 1981
-1.921
-10.877
-121.45%
jan 1, 1982
-1.935
-0.014
0.74%
jan 1, 1983
1.355
+3.29
-170.01%
jan 1, 1984
-1.232
-2.587
-190.96%
jan 1, 1985
6.393
+7.625
-618.78%
jan 1, 1986
0.407
-5.985
-93.63%
jan 1, 1987
4.589
+4.182
1.03K%
jan 1, 1988
6.753
+2.164
47.16%
jan 1, 1989
10.42
+3.667
54.31%
jan 1, 1990
9.693
-0.727
-6.97%
jan 1, 1991
4.869
-4.825
-49.77%
jan 1, 1992
2.859
-2.01
-41.27%
jan 1, 1993
4.117
+1.258
43.99%
jan 1, 1994
-0.361
-4.478
-108.76%
jan 1, 1995
7.28
+7.641
-2.12K%
jan 1, 1996
4.652
-2.629
-36.11%
jan 1, 1997
5.475
+0.824
17.71%
jan 1, 1998
8.218
+2.742
50.09%
jan 1, 1999
4.993
-3.225
-39.24%
jan 1, 2000
3.26
-1.733
-34.7%
jan 1, 2001
13.138
+9.877
302.95%
jan 1, 2002
-0.689
-13.827
-105.25%
jan 1, 2003
0.912
+1.601
-232.39%
jan 1, 2004
1.479
+0.567
62.1%
jan 1, 2005
6.279
+4.801
324.64%
jan 1, 2006
6.209
-0.07
-1.12%
jan 1, 2007
4.6
-1.609
-25.91%
jan 1, 2008
5.854
+1.254
27.26%
jan 1, 2009
3.556
-2.298
-39.26%
jan 1, 2010
-9.115
-12.671
-356.33%
jan 1, 2011
9.625
+18.74
-205.59%
jan 1, 2012
7.311
-2.314
-24.04%
jan 1, 2013
1.405
-5.906
-80.78%
jan 1, 2014
0.297
-1.108
-78.85%
jan 1, 2015
5.872
+5.575
1.88K%
jan 1, 2016
4.318
-1.554
-26.46%
Ranking of countries by current statistics by years


Comments: