29
/
en
AIzaSyAYiBZKx7MnpbEhh9jyipgxe19OcubqV5w
April 1, 2024
119026
Denmark
DNK
true
2
1
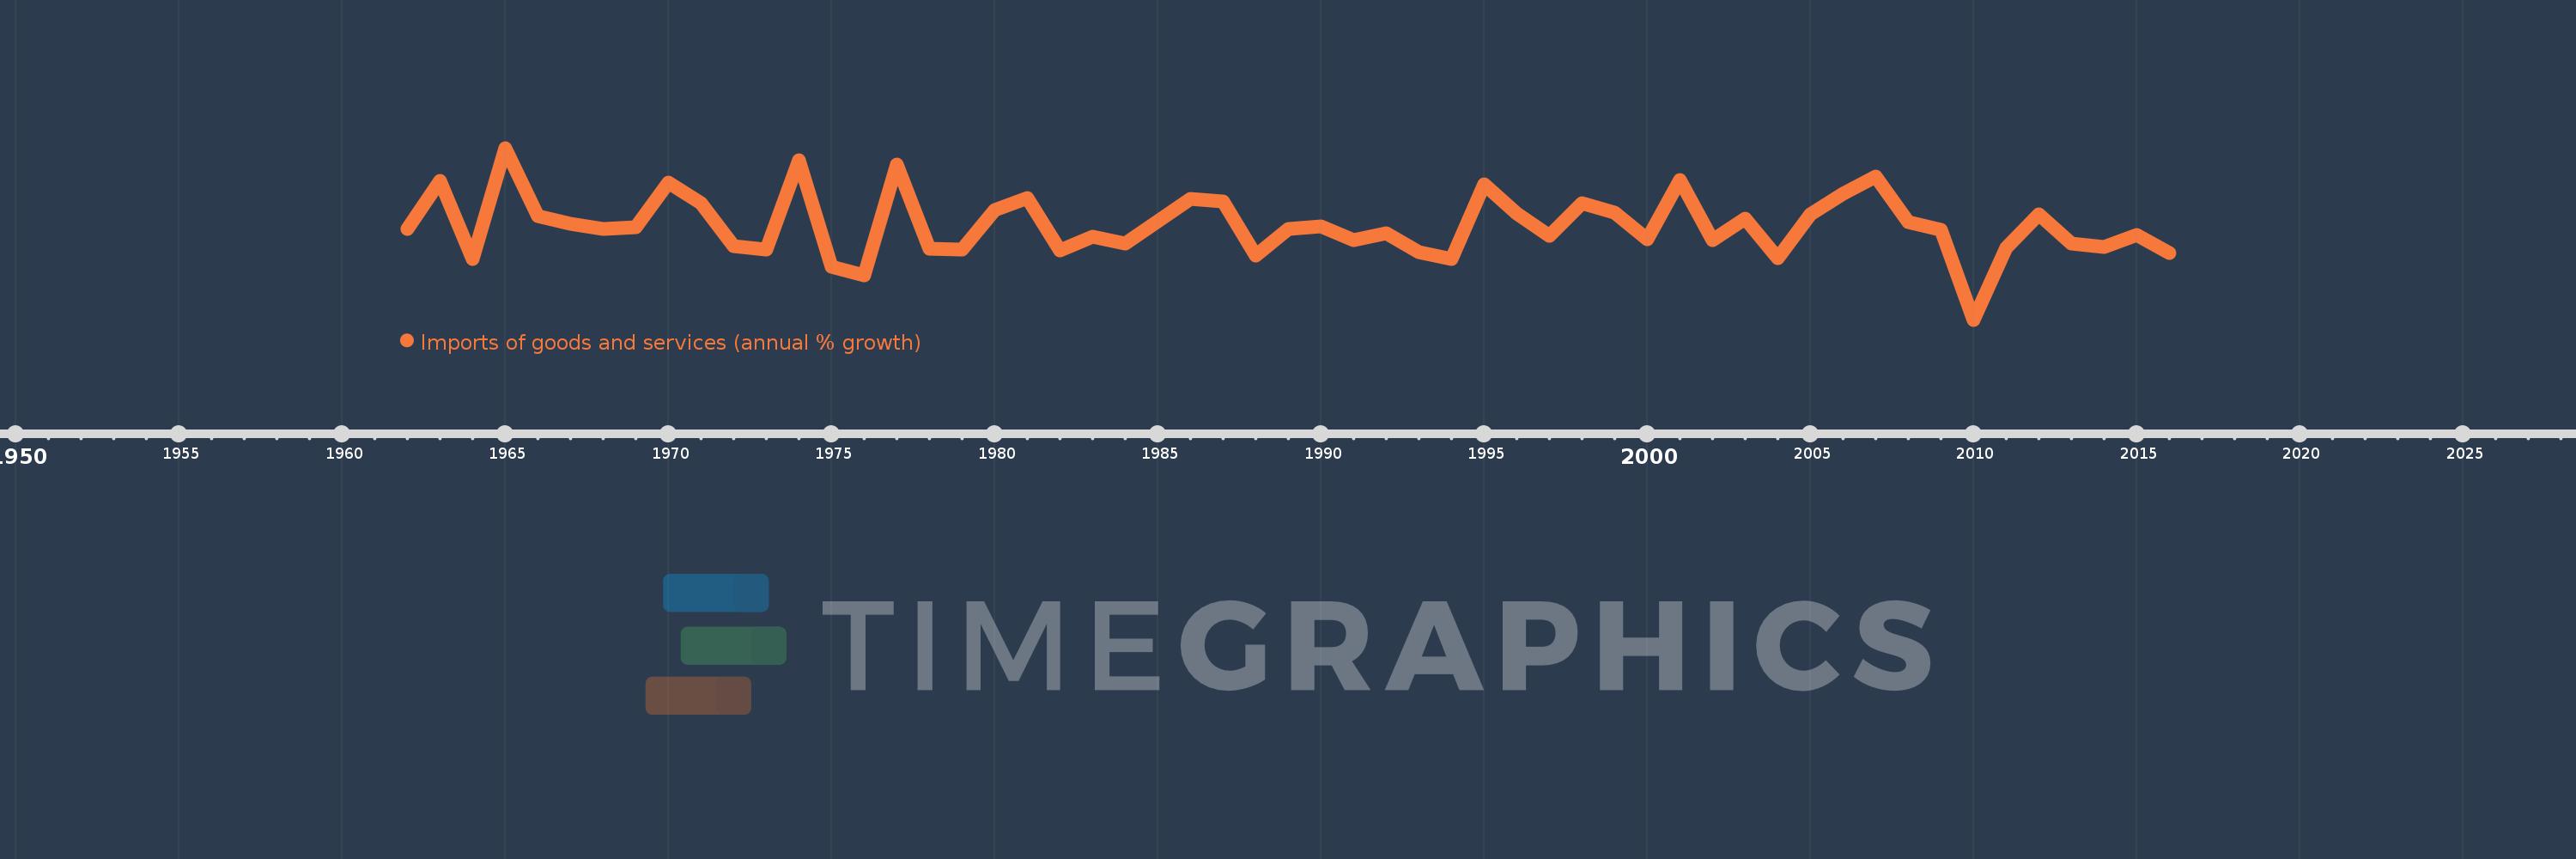
Imports of goods and services (annual % growth)
2016,2015,2014,2013,2012,2011,2010,2009,2008,2007,2006,2005,2004,2003,2002,2001,2000,1999,1998,1997,1996,1995,1994,1993,1992,1991,1990,1989,1988,1987,1986,1985,1984,1983,1982,1981,1980,1979,1978,1977,1976,1975,1974,1973,1972,1971,1970,1969,1968,1967,1966,1965,1964,1963,1962
This statistics in other country:
AlbaniaAlgeriaAngolaAntigua and BarbudaArab WorldArgentinaArmeniaAustraliaAustriaAzerbaijanBahamas, TheBahrainBangladeshBarbadosBelarusBelgiumBelizeBeninBhutanBoliviaBosnia and HerzegovinaBotswanaBrazilBrunei DarussalamBulgariaBurkina FasoBurundiCabo VerdeCambodiaCameroonCanadaCaribbean small statesCentral Europe and the BalticsChadChileColombiaComorosCongo, Dem. Rep.Congo, Rep.Costa RicaCote d'IvoireCroatiaCubaCyprusCzech RepublicDenmarkDjiboutiDominican RepublicEarly-demographic dividendEast Asia & PacificEcuadorEgypt, Arab Rep.El SalvadorEquatorial GuineaEritreaEstoniaEthiopiaEuro areaEurope & Central AsiaEurope & Central Asia (excluding high income)Europe & Central Asia (IDA & IBRD countries)European UnionFijiFinlandFranceGabonGambia, TheGeorgiaGermanyGhanaGreeceGuatemalaGuineaGuinea-BissauHaitiHeavily indebted poor countries (HIPC)High incomeHondurasHong Kong SAR, ChinaHungaryIBRD onlyIcelandIDA & IBRD totalIDA blendIDA onlyIDA totalIndiaIndonesiaIran, Islamic Rep.IrelandIsraelItalyJamaicaJapanJordanKazakhstanKenyaKorea, Rep.KosovoKuwaitKyrgyz RepublicLao PDRLatin America & Caribbean Latin America & Caribbean (excluding high income)Latin America & the Caribbean (IDA & IBRD countries)LatviaLeast developed countries: UN classificationLebanonLiberiaLibyaLithuaniaLow & middle incomeLow incomeLower middle incomeLuxembourgMacao SAR, ChinaMacedonia, FYRMadagascarMalawiMalaysiaMaliMaltaMauritaniaMauritiusMexicoMiddle East & North AfricaMiddle East & North Africa (excluding high income)Middle East & North Africa (IDA & IBRD countries)Middle incomeMoldovaMongoliaMontenegroMoroccoMozambiqueMyanmarNamibiaNepalNetherlandsNew ZealandNicaraguaNigerNigeriaNorth AmericaNorwayOECD membersOmanOther small statesPakistanPanamaPapua New GuineaParaguayPeruPhilippinesPolandPortugalPost-demographic dividendPre-demographic dividendPuerto RicoQatarRomaniaRussian FederationRwandaSamoaSaudi ArabiaSenegalSerbiaSeychellesSierra LeoneSingaporeSlovak RepublicSloveniaSmall statesSomaliaSouth AfricaSouth AsiaSouth Asia (IDA & IBRD)South SudanSpainSri LankaSub-Saharan Africa Sub-Saharan Africa (excluding high income)Sub-Saharan Africa (IDA & IBRD countries)SudanSurinameSwazilandSwedenSwitzerlandSyrian Arab RepublicTajikistanTanzaniaThailandTimor-LesteTogoTrinidad and TobagoTunisiaTurkeyTurkmenistanUgandaUkraineUnited Arab EmiratesUnited KingdomUnited StatesUruguayUzbekistanVanuatuVenezuela, RBVietnamWest Bank and GazaWorldZambiaZimbabwe Timeline:
This timeline shows a graph from 1962 to 2016 of Denmark. No data until 1961. Number of actual observations by date: 55.
Source name:
World Development Indicators
Source organization:
World Bank national accounts data, and OECD National Accounts data files.
Categories, topics:
Economy & Growth, Trade
Last updated:
apr 23, 2017
Indicators value changes by year
Minimum:
-12.43
jan 1, 2010
Maximum:
19.554
jan 1, 1965
At the date of observation
Value
Absolute change
Change from previous value
jan 1, 1962
4.449
+4.449
0.0%
jan 1, 1963
13.366
+8.917
200.41%
jan 1, 1964
-1.091
-14.457
-108.16%
jan 1, 1965
19.554
+20.645
-1.89K%
jan 1, 1966
6.883
-12.671
-64.8%
jan 1, 1967
5.442
-1.441
-20.93%
jan 1, 1968
4.494
-0.948
-17.42%
jan 1, 1969
4.858
+0.364
8.09%
jan 1, 1970
13.137
+8.279
170.43%
jan 1, 1971
9.321
-3.816
-29.05%
jan 1, 1972
1.263
-8.058
-86.45%
jan 1, 1973
0.695
-0.569
-45.01%
jan 1, 1974
17.282
+16.587
2.39K%
jan 1, 1975
-2.631
-19.913
-115.22%
jan 1, 1976
-4.12
-1.49
56.62%
jan 1, 1977
16.496
+20.617
-500.36%
jan 1, 1978
0.763
-15.733
-95.37%
jan 1, 1979
0.64
-0.123
-16.07%
jan 1, 1980
8.014
+7.374
1.15K%
jan 1, 1981
10.219
+2.205
27.51%
jan 1, 1982
0.452
-9.767
-95.58%
jan 1, 1983
3.105
+2.653
587.05%
jan 1, 1984
1.767
-1.338
-43.09%
jan 1, 1985
5.971
+4.204
237.86%
jan 1, 1986
10.111
+4.14
69.33%
jan 1, 1987
9.512
-0.599
-5.93%
jan 1, 1988
-0.466
-9.978
-104.9%
jan 1, 1989
4.45
+4.916
-1.06K%
jan 1, 1990
4.988
+0.538
12.09%
jan 1, 1991
2.341
-2.647
-53.07%
jan 1, 1992
3.6
+1.259
53.79%
jan 1, 1993
0.077
-3.523
-97.86%
jan 1, 1994
-1.099
-1.176
-1.53K%
jan 1, 1995
12.812
+13.911
-1.27K%
jan 1, 1996
7.404
-5.408
-42.21%
jan 1, 1997
3.121
-4.283
-57.84%
jan 1, 1998
9.208
+6.086
194.99%
jan 1, 1999
7.575
-1.633
-17.73%
jan 1, 2000
2.553
-5.022
-66.3%
jan 1, 2001
13.667
+11.114
435.33%
jan 1, 2002
2.395
-11.272
-82.47%
jan 1, 2003
6.376
+3.981
166.2%
jan 1, 2004
-1.024
-7.4
-116.07%
jan 1, 2005
7.137
+8.161
-796.69%
jan 1, 2006
11.004
+3.867
54.19%
jan 1, 2007
14.218
+3.215
29.22%
jan 1, 2008
5.702
-8.517
-59.9%
jan 1, 2009
4.259
-1.443
-25.31%
jan 1, 2010
-12.43
-16.688
-391.88%
jan 1, 2011
0.919
+13.348
-107.39%
jan 1, 2012
7.149
+6.23
678.24%
jan 1, 2013
1.817
-5.332
-74.58%
jan 1, 2014
1.127
-0.69
-37.96%
jan 1, 2015
3.31
+2.183
193.61%
jan 1, 2016
-0.001
-3.311
-100.04%
Ranking of countries by current statistics by years


Comments: