29
/
en
AIzaSyAYiBZKx7MnpbEhh9jyipgxe19OcubqV5w
April 1, 2024
150501
Honduras
HND
true
2
1
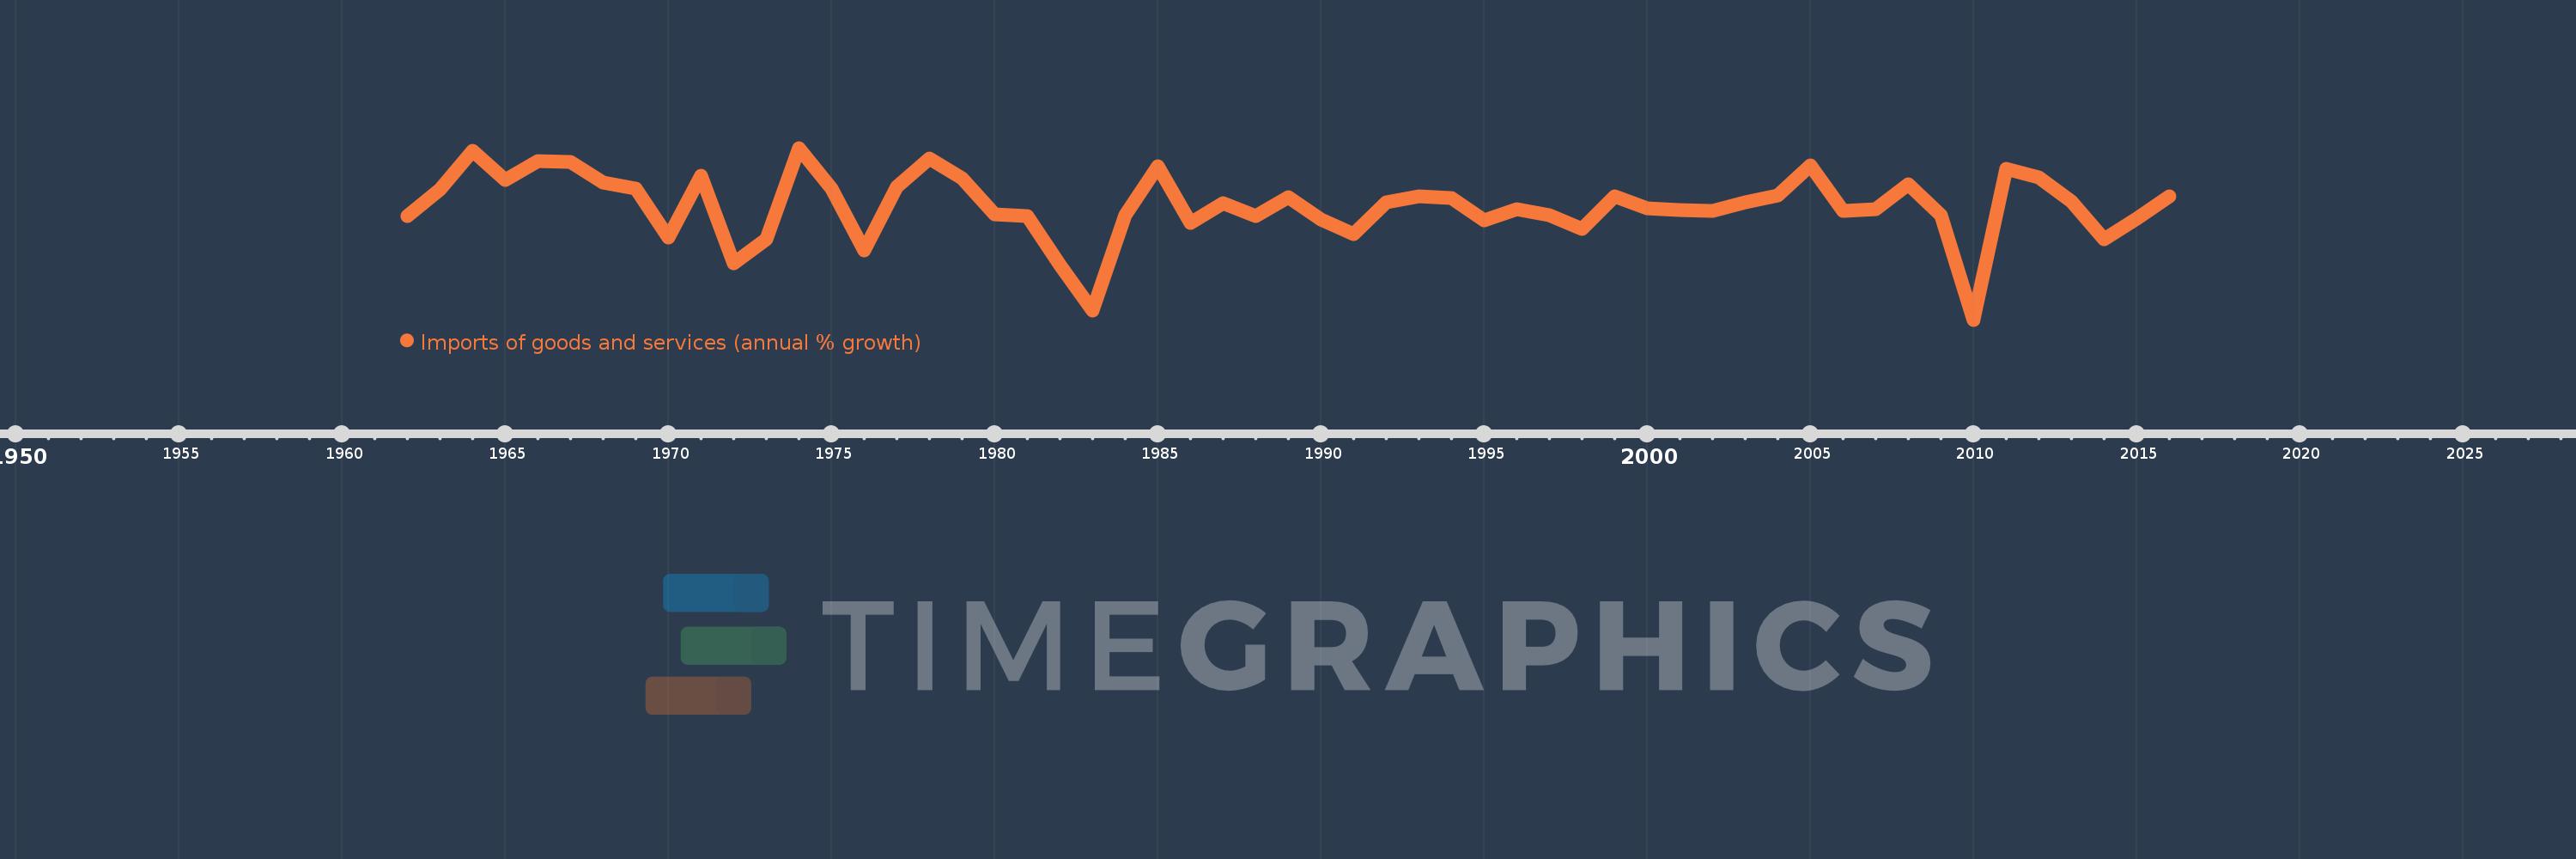
Imports of goods and services (annual % growth)
2016,2015,2014,2013,2012,2011,2010,2009,2008,2007,2006,2005,2004,2003,2002,2001,2000,1999,1998,1997,1996,1995,1994,1993,1992,1991,1990,1989,1988,1987,1986,1985,1984,1983,1982,1981,1980,1979,1978,1977,1976,1975,1974,1973,1972,1971,1970,1969,1968,1967,1966,1965,1964,1963,1962
This statistics in other country:
AlbaniaAlgeriaAngolaAntigua and BarbudaArab WorldArgentinaArmeniaAustraliaAustriaAzerbaijanBahamas, TheBahrainBangladeshBarbadosBelarusBelgiumBelizeBeninBhutanBoliviaBosnia and HerzegovinaBotswanaBrazilBrunei DarussalamBulgariaBurkina FasoBurundiCabo VerdeCambodiaCameroonCanadaCaribbean small statesCentral Europe and the BalticsChadChileColombiaComorosCongo, Dem. Rep.Congo, Rep.Costa RicaCote d'IvoireCroatiaCubaCyprusCzech RepublicDenmarkDjiboutiDominican RepublicEarly-demographic dividendEast Asia & PacificEcuadorEgypt, Arab Rep.El SalvadorEquatorial GuineaEritreaEstoniaEthiopiaEuro areaEurope & Central AsiaEurope & Central Asia (excluding high income)Europe & Central Asia (IDA & IBRD countries)European UnionFijiFinlandFranceGabonGambia, TheGeorgiaGermanyGhanaGreeceGuatemalaGuineaGuinea-BissauHaitiHeavily indebted poor countries (HIPC)High incomeHondurasHong Kong SAR, ChinaHungaryIBRD onlyIcelandIDA & IBRD totalIDA blendIDA onlyIDA totalIndiaIndonesiaIran, Islamic Rep.IrelandIsraelItalyJamaicaJapanJordanKazakhstanKenyaKorea, Rep.KosovoKuwaitKyrgyz RepublicLao PDRLatin America & Caribbean Latin America & Caribbean (excluding high income)Latin America & the Caribbean (IDA & IBRD countries)LatviaLeast developed countries: UN classificationLebanonLiberiaLibyaLithuaniaLow & middle incomeLow incomeLower middle incomeLuxembourgMacao SAR, ChinaMacedonia, FYRMadagascarMalawiMalaysiaMaliMaltaMauritaniaMauritiusMexicoMiddle East & North AfricaMiddle East & North Africa (excluding high income)Middle East & North Africa (IDA & IBRD countries)Middle incomeMoldovaMongoliaMontenegroMoroccoMozambiqueMyanmarNamibiaNepalNetherlandsNew ZealandNicaraguaNigerNigeriaNorth AmericaNorwayOECD membersOmanOther small statesPakistanPanamaPapua New GuineaParaguayPeruPhilippinesPolandPortugalPost-demographic dividendPre-demographic dividendPuerto RicoQatarRomaniaRussian FederationRwandaSamoaSaudi ArabiaSenegalSerbiaSeychellesSierra LeoneSingaporeSlovak RepublicSloveniaSmall statesSomaliaSouth AfricaSouth AsiaSouth Asia (IDA & IBRD)South SudanSpainSri LankaSub-Saharan Africa Sub-Saharan Africa (excluding high income)Sub-Saharan Africa (IDA & IBRD countries)SudanSurinameSwazilandSwedenSwitzerlandSyrian Arab RepublicTajikistanTanzaniaThailandTimor-LesteTogoTrinidad and TobagoTunisiaTurkeyTurkmenistanUgandaUkraineUnited Arab EmiratesUnited KingdomUnited StatesUruguayUzbekistanVanuatuVenezuela, RBVietnamWest Bank and GazaWorldZambiaZimbabwe Timeline:
This timeline shows a graph from 1962 to 2016 of Honduras. No data until 1961. Number of actual observations by date: 55.
Source name:
World Development Indicators
Source organization:
World Bank national accounts data, and OECD National Accounts data files.
Categories, topics:
Economy & Growth, Trade
Last updated:
apr 23, 2017
Indicators value changes by year
Minimum:
-26.209
jan 1, 2010
Maximum:
20.833
jan 1, 1974
At the date of observation
Value
Absolute change
Change from previous value
jan 1, 1962
2.126
+2.126
0.0%
jan 1, 1963
9.581
+7.455
350.68%
jan 1, 1964
20.093
+10.512
109.71%
jan 1, 1965
12.127
-7.965
-39.64%
jan 1, 1966
17.146
+5.019
41.38%
jan 1, 1967
16.968
-0.178
-1.04%
jan 1, 1968
11.246
-5.722
-33.72%
jan 1, 1969
9.729
-1.517
-13.49%
jan 1, 1970
-3.644
-13.374
-137.45%
jan 1, 1971
13.343
+16.987
-466.16%
jan 1, 1972
-10.693
-24.036
-180.14%
jan 1, 1973
-4.213
+6.48
-60.6%
jan 1, 1974
20.833
+25.046
-594.52%
jan 1, 1975
9.674
-11.159
-53.56%
jan 1, 1976
-7.162
-16.836
-174.03%
jan 1, 1977
10.066
+17.227
-240.55%
jan 1, 1978
18.034
+7.968
79.16%
jan 1, 1979
12.6
-5.435
-30.14%
jan 1, 1980
2.572
-10.027
-79.58%
jan 1, 1981
2.257
-0.315
-12.26%
jan 1, 1982
-11.343
-13.6
-602.55%
jan 1, 1983
-23.582
-12.24
107.91%
jan 1, 1984
2.353
+25.935
-109.98%
jan 1, 1985
15.915
+13.562
576.39%
jan 1, 1986
0.381
-15.534
-97.6%
jan 1, 1987
5.623
+5.242
1.37K%
jan 1, 1988
2.23
-3.393
-60.34%
jan 1, 1989
7.46
+5.229
234.48%
jan 1, 1990
1.244
-6.215
-83.32%
jan 1, 1991
-2.846
-4.09
-328.73%
jan 1, 1992
5.992
+8.838
-310.54%
jan 1, 1993
7.475
+1.483
24.75%
jan 1, 1994
7.072
-0.403
-5.39%
jan 1, 1995
1.092
-5.98
-84.56%
jan 1, 1996
3.996
+2.904
266.0%
jan 1, 1997
2.44
-1.555
-38.93%
jan 1, 1998
-1.419
-3.859
-158.16%
jan 1, 1999
7.506
+8.926
-628.94%
jan 1, 2000
4.256
-3.25
-43.3%
jan 1, 2001
3.807
-0.449
-10.55%
jan 1, 2002
3.584
-0.223
-5.86%
jan 1, 2003
5.903
+2.319
64.69%
jan 1, 2004
7.886
+1.983
33.6%
jan 1, 2005
16.166
+8.281
105.01%
jan 1, 2006
3.616
-12.551
-77.63%
jan 1, 2007
4.056
+0.44
12.18%
jan 1, 2008
10.887
+6.831
168.4%
jan 1, 2009
2.381
-8.506
-78.13%
jan 1, 2010
-26.209
-28.59
-1.2K%
jan 1, 2011
15.205
+41.414
-158.01%
jan 1, 2012
12.666
-2.539
-16.7%
jan 1, 2013
6.279
-6.387
-50.43%
jan 1, 2014
-4.096
-10.375
-165.24%
jan 1, 2015
1.454
+5.55
-135.49%
jan 1, 2016
7.627
+6.173
424.56%
Ranking of countries by current statistics by years


Comments: