29
/
en
AIzaSyAYiBZKx7MnpbEhh9jyipgxe19OcubqV5w
April 1, 2024
49093
Middle East & North Africa (excluding high income)
MNA
false
2
1
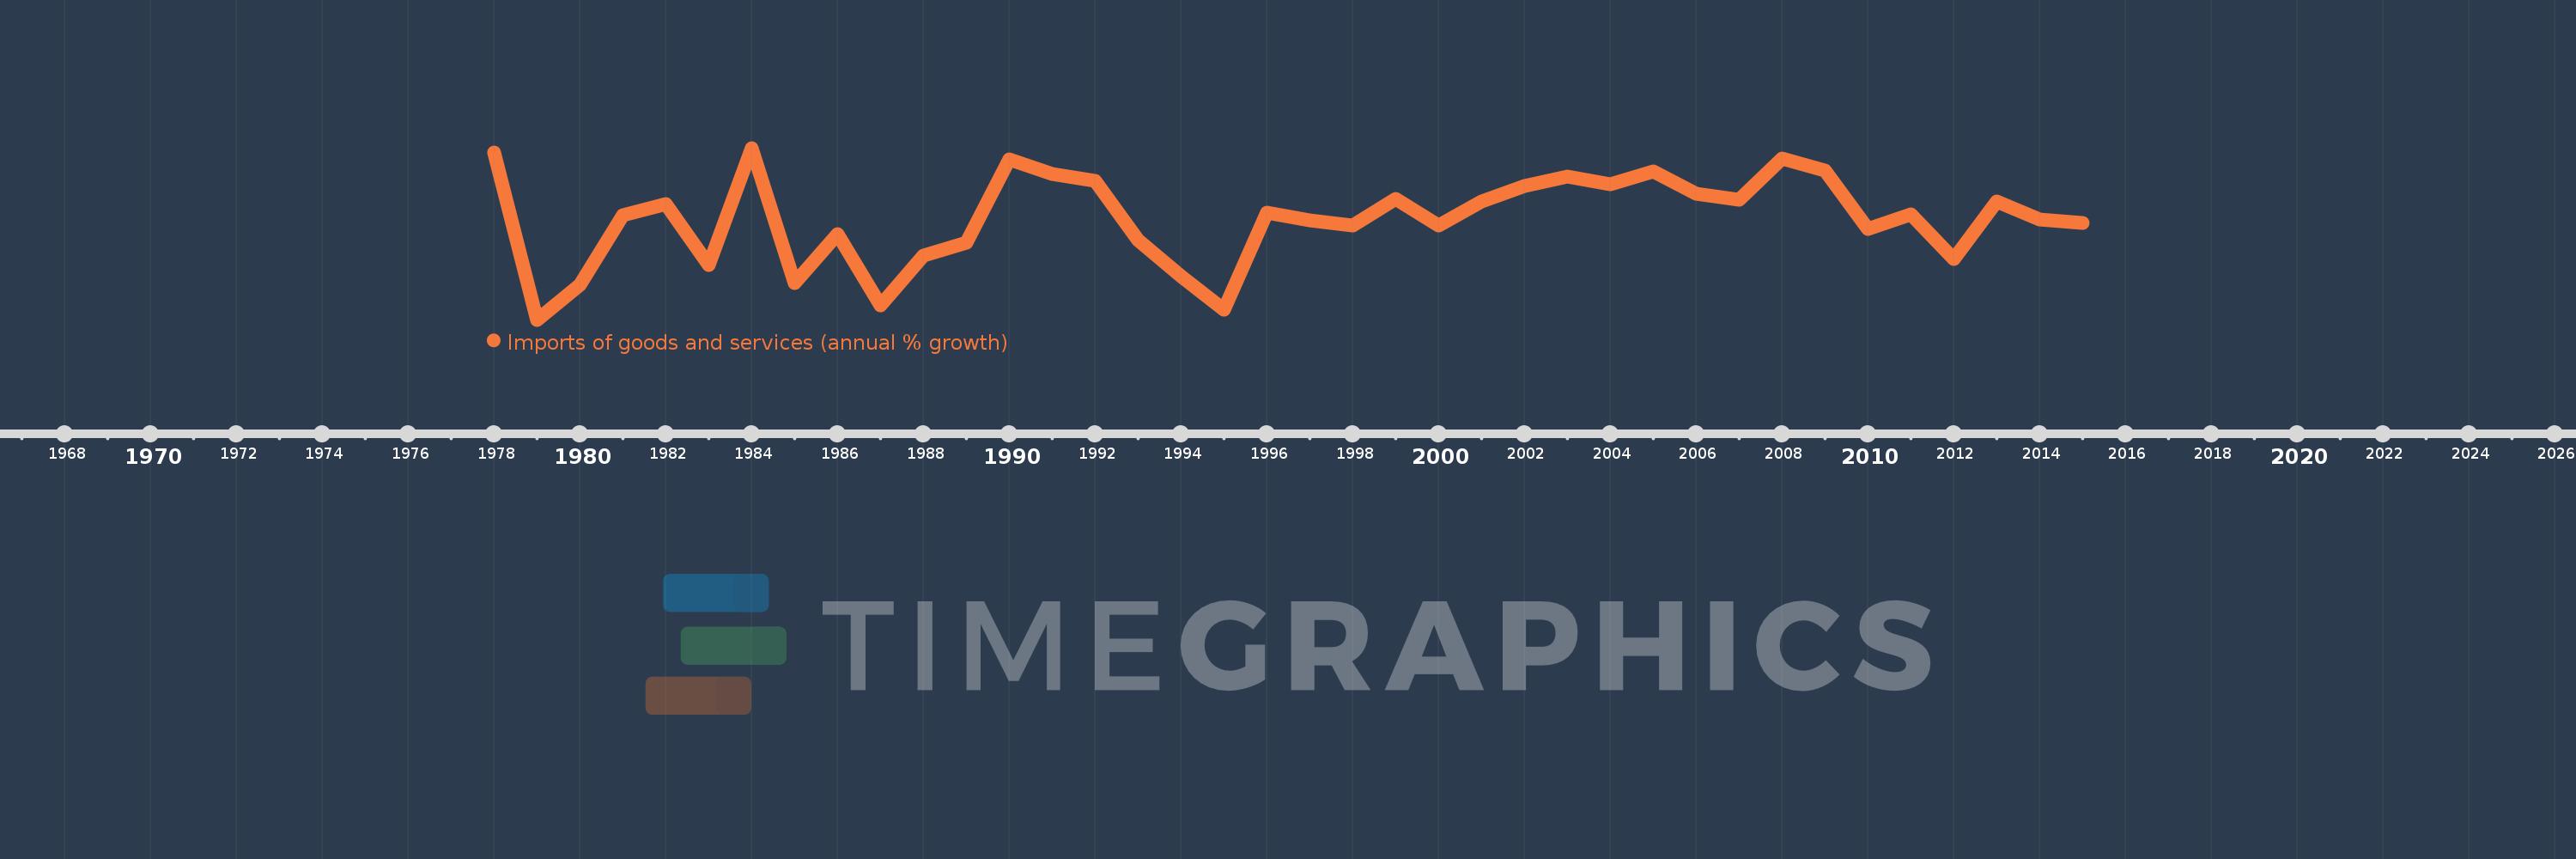
Imports of goods and services (annual % growth)
2015,2014,2013,2012,2011,2010,2009,2008,2007,2006,2005,2004,2003,2002,2001,2000,1999,1998,1997,1996,1995,1994,1993,1992,1991,1990,1989,1988,1987,1986,1985,1984,1983,1982,1981,1980,1979,1978
This statistics in other country:
AlbaniaAlgeriaAngolaAntigua and BarbudaArab WorldArgentinaArmeniaAustraliaAustriaAzerbaijanBahamas, TheBahrainBangladeshBarbadosBelarusBelgiumBelizeBeninBhutanBoliviaBosnia and HerzegovinaBotswanaBrazilBrunei DarussalamBulgariaBurkina FasoBurundiCabo VerdeCambodiaCameroonCanadaCaribbean small statesCentral Europe and the BalticsChadChileColombiaComorosCongo, Dem. Rep.Congo, Rep.Costa RicaCote d'IvoireCroatiaCubaCyprusCzech RepublicDenmarkDjiboutiDominican RepublicEarly-demographic dividendEast Asia & PacificEcuadorEgypt, Arab Rep.El SalvadorEquatorial GuineaEritreaEstoniaEthiopiaEuro areaEurope & Central AsiaEurope & Central Asia (excluding high income)Europe & Central Asia (IDA & IBRD countries)European UnionFijiFinlandFranceGabonGambia, TheGeorgiaGermanyGhanaGreeceGuatemalaGuineaGuinea-BissauHaitiHeavily indebted poor countries (HIPC)High incomeHondurasHong Kong SAR, ChinaHungaryIBRD onlyIcelandIDA & IBRD totalIDA blendIDA onlyIDA totalIndiaIndonesiaIran, Islamic Rep.IrelandIsraelItalyJamaicaJapanJordanKazakhstanKenyaKorea, Rep.KosovoKuwaitKyrgyz RepublicLao PDRLatin America & Caribbean Latin America & Caribbean (excluding high income)Latin America & the Caribbean (IDA & IBRD countries)LatviaLeast developed countries: UN classificationLebanonLiberiaLibyaLithuaniaLow & middle incomeLow incomeLower middle incomeLuxembourgMacao SAR, ChinaMacedonia, FYRMadagascarMalawiMalaysiaMaliMaltaMauritaniaMauritiusMexicoMiddle East & North AfricaMiddle East & North Africa (excluding high income)Middle East & North Africa (IDA & IBRD countries)Middle incomeMoldovaMongoliaMontenegroMoroccoMozambiqueMyanmarNamibiaNepalNetherlandsNew ZealandNicaraguaNigerNigeriaNorth AmericaNorwayOECD membersOmanOther small statesPakistanPanamaPapua New GuineaParaguayPeruPhilippinesPolandPortugalPost-demographic dividendPre-demographic dividendPuerto RicoQatarRomaniaRussian FederationRwandaSamoaSaudi ArabiaSenegalSerbiaSeychellesSierra LeoneSingaporeSlovak RepublicSloveniaSmall statesSomaliaSouth AfricaSouth AsiaSouth Asia (IDA & IBRD)South SudanSpainSri LankaSub-Saharan Africa Sub-Saharan Africa (excluding high income)Sub-Saharan Africa (IDA & IBRD countries)SudanSurinameSwazilandSwedenSwitzerlandSyrian Arab RepublicTajikistanTanzaniaThailandTimor-LesteTogoTrinidad and TobagoTunisiaTurkeyTurkmenistanUgandaUkraineUnited Arab EmiratesUnited KingdomUnited StatesUruguayUzbekistanVanuatuVenezuela, RBVietnamWest Bank and GazaWorldZambiaZimbabwe Timeline:
This timeline shows a graph from 1978 to 2015 of Middle East & North Africa (excluding high income). No data until 1977. Number of actual observations by date: 38.
Source name:
World Development Indicators
Source organization:
World Bank national accounts data, and OECD National Accounts data files.
Categories, topics:
Economy & Growth, Trade
Last updated:
apr 23, 2017
Indicators value changes by year
Minimum:
-17.808
jan 1, 1979
Maximum:
15.703
jan 1, 1984
At the date of observation
Value
Absolute change
Change from previous value
jan 1, 1978
14.876
+14.876
0.0%
jan 1, 1979
-17.808
-32.684
-219.71%
jan 1, 1980
-11.056
+6.752
-37.91%
jan 1, 1981
2.6
+13.656
-123.52%
jan 1, 1982
4.746
+2.146
82.54%
jan 1, 1983
-7.213
-11.959
-251.99%
jan 1, 1984
15.703
+22.916
-317.7%
jan 1, 1985
-10.606
-26.309
-167.54%
jan 1, 1986
-1.155
+9.452
-89.11%
jan 1, 1987
-15.049
-13.895
1.2K%
jan 1, 1988
-5.31
+9.739
-64.71%
jan 1, 1989
-2.696
+2.615
-49.24%
jan 1, 1990
13.534
+16.23
-602.04%
jan 1, 1991
10.682
-2.852
-21.07%
jan 1, 1992
9.223
-1.458
-13.65%
jan 1, 1993
-2.262
-11.485
-124.52%
jan 1, 1994
-9.375
-7.113
314.53%
jan 1, 1995
-15.895
-6.52
69.54%
jan 1, 1996
3.135
+19.029
-119.72%
jan 1, 1997
1.64
-1.494
-47.67%
jan 1, 1998
0.642
-0.999
-60.88%
jan 1, 1999
5.772
+5.13
799.55%
jan 1, 2000
0.493
-5.279
-91.46%
jan 1, 2001
5.207
+4.714
956.18%
jan 1, 2002
8.329
+3.122
59.95%
jan 1, 2003
10.043
+1.714
20.57%
jan 1, 2004
8.591
-1.452
-14.46%
jan 1, 2005
11.208
+2.617
30.46%
jan 1, 2006
6.777
-4.431
-39.53%
jan 1, 2007
5.529
-1.248
-18.41%
jan 1, 2008
13.594
+8.064
145.84%
jan 1, 2009
11.37
-2.223
-16.36%
jan 1, 2010
-0.151
-11.521
-101.33%
jan 1, 2011
2.793
+2.944
-1.95K%
jan 1, 2012
-5.88
-8.673
-310.56%
jan 1, 2013
5.21
+11.09
-188.6%
jan 1, 2014
1.694
-3.515
-67.47%
jan 1, 2015
1.128
-0.567
-33.44%
Ranking of countries by current statistics by years


Comments: